How to Monitor Stewardship Responsibilities
In Blindata, the Stewardship module offers dashboards for managing responsibilities across resources. This dashboards provides insights into the distribution of responsibilities, user workloads, and resource coverage.
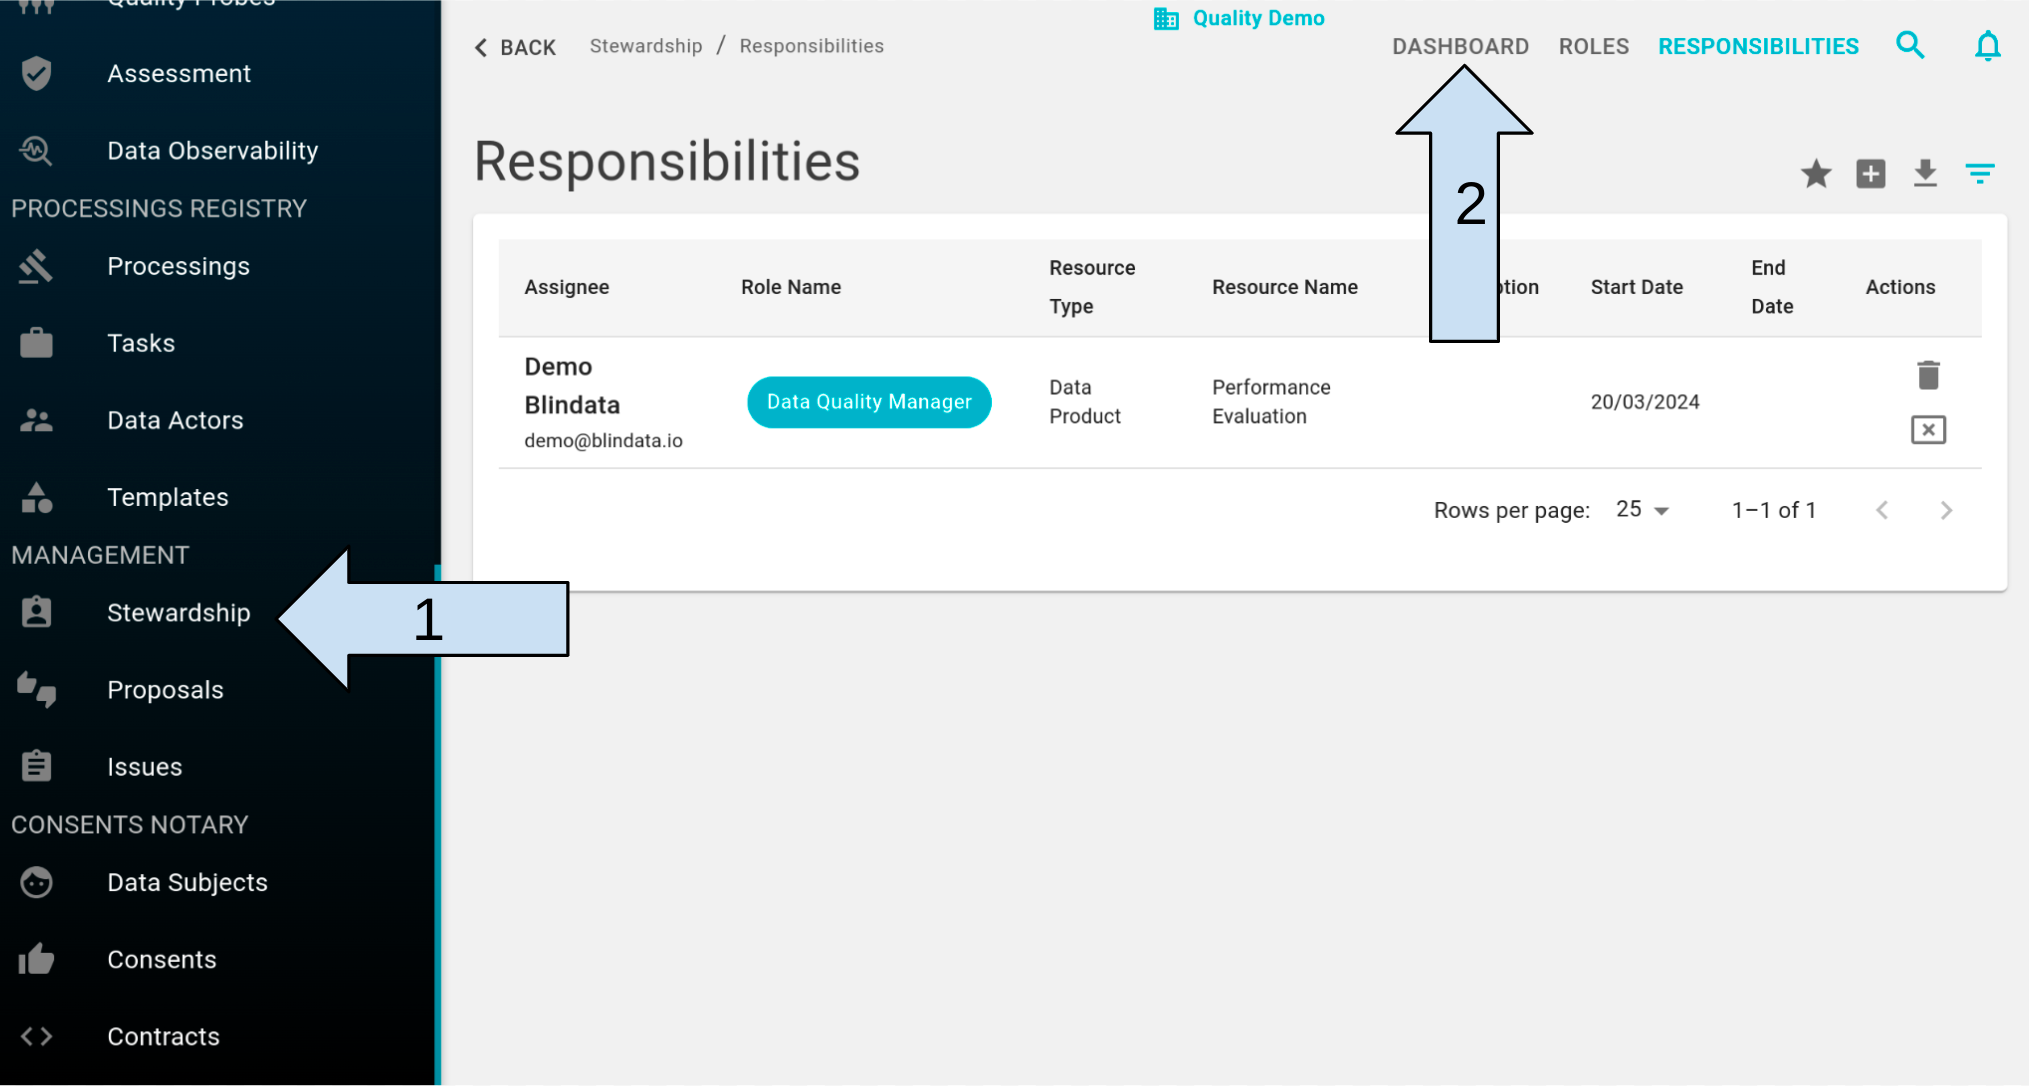
To access the dashboard, navigate to the “Dashboards” tab in the Stewardship module.
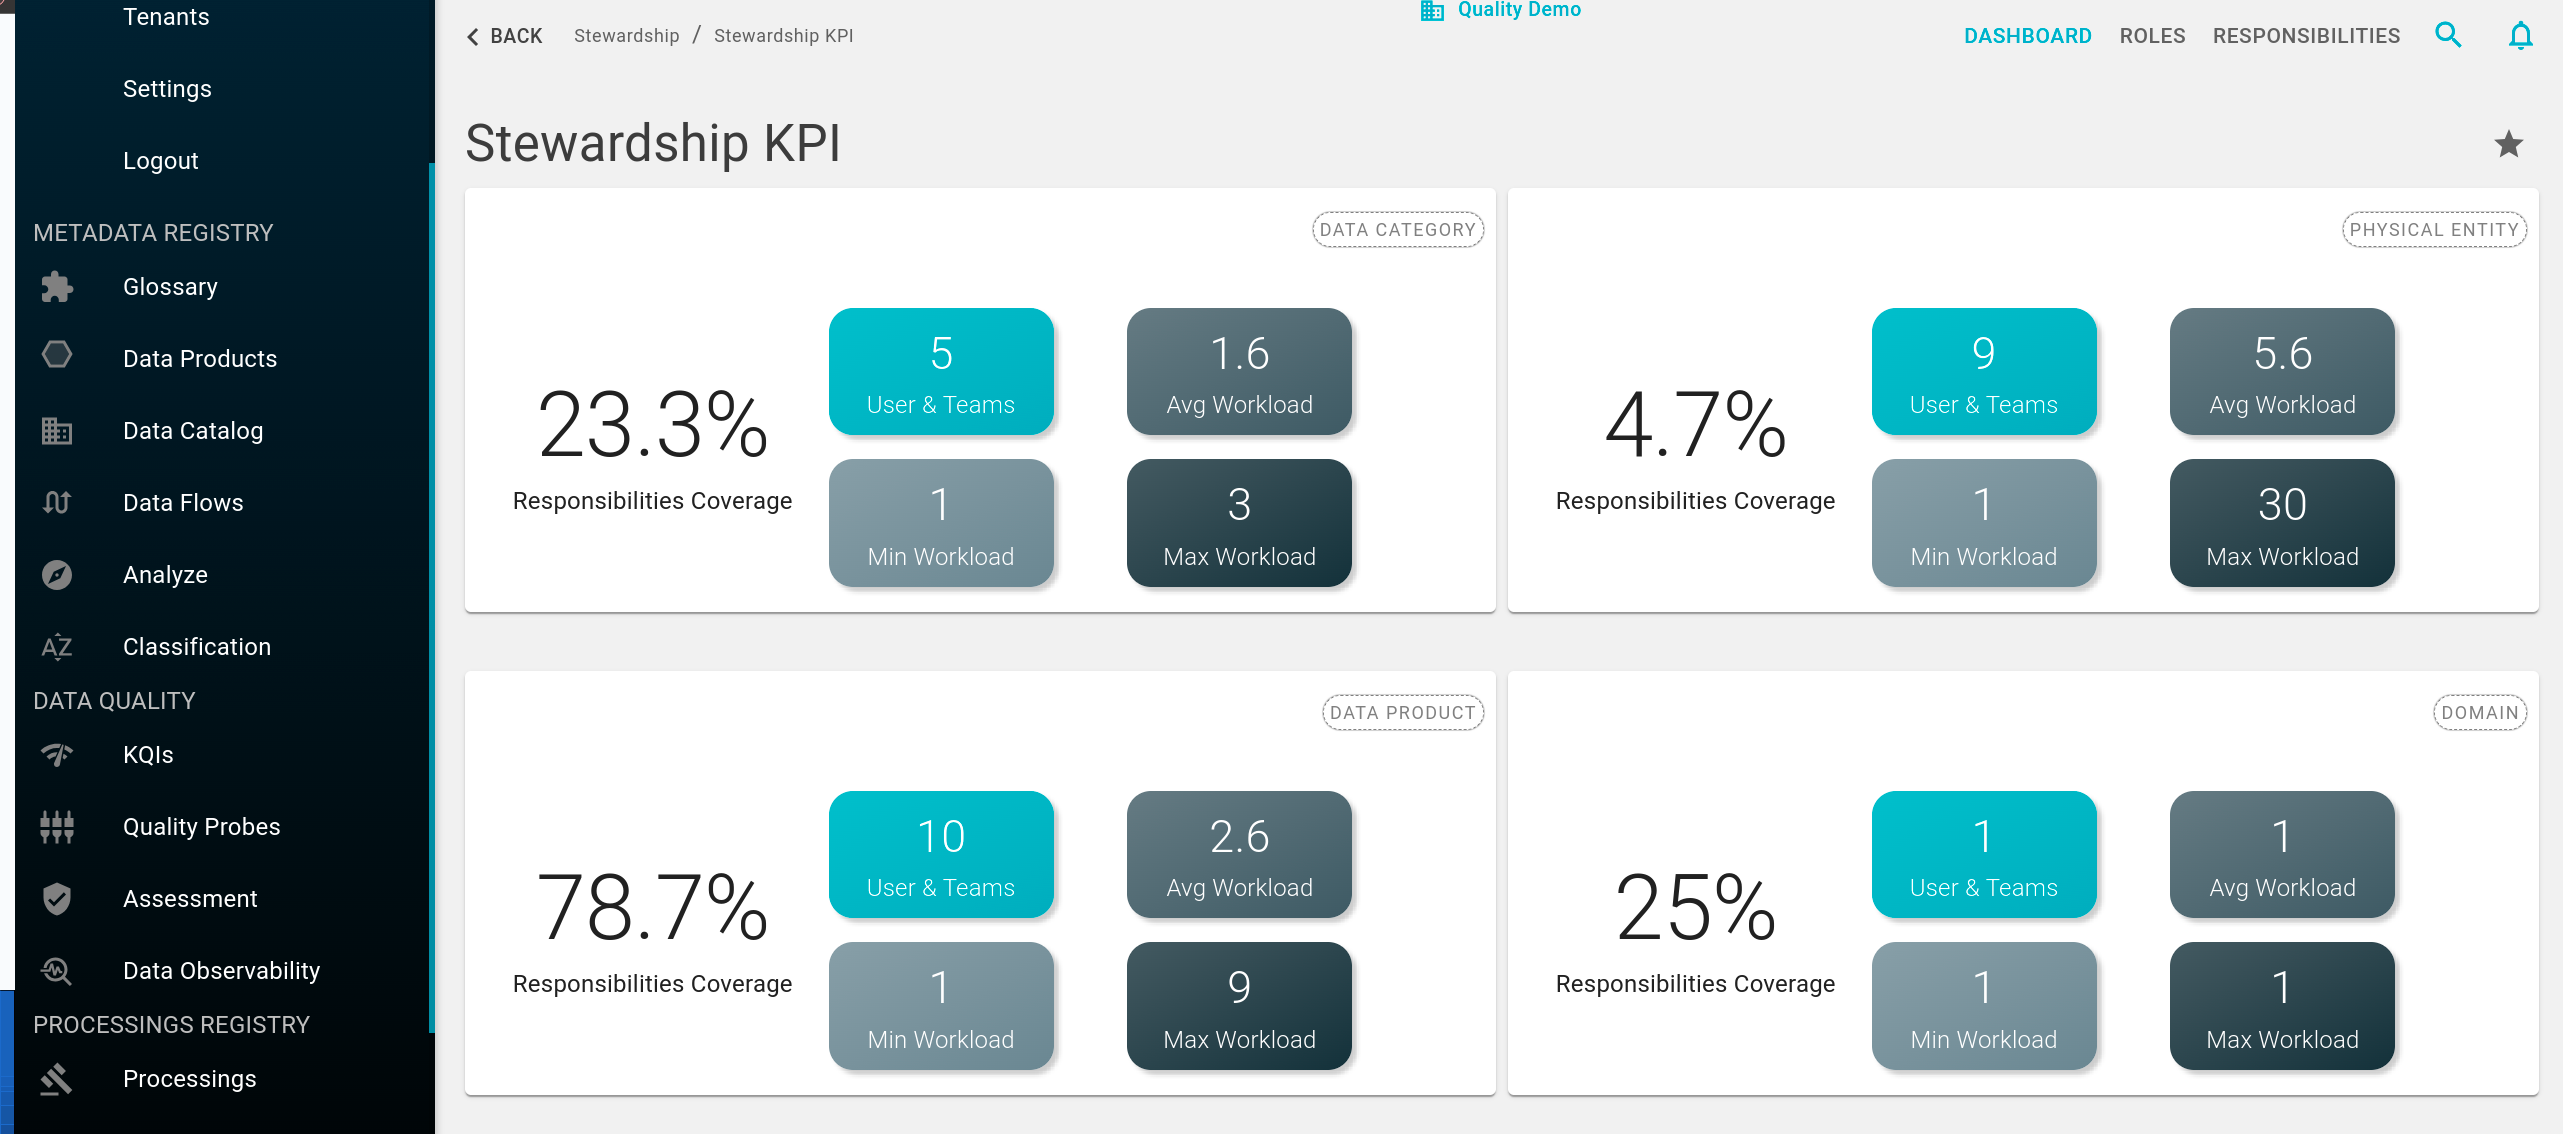
General Key Performance Indicators (KPIs) by Resource Type
The dashboard’s first section displays general data categorized by resource type. Each card represents a resource type, such as Concepts, Physical Entity, and Data Product. Cards provide the following information:
- Percentage of resources with assigned responsibilities.
- Number of users or teams involved.
- Average user workload.
- Minimum and maximum workloads.
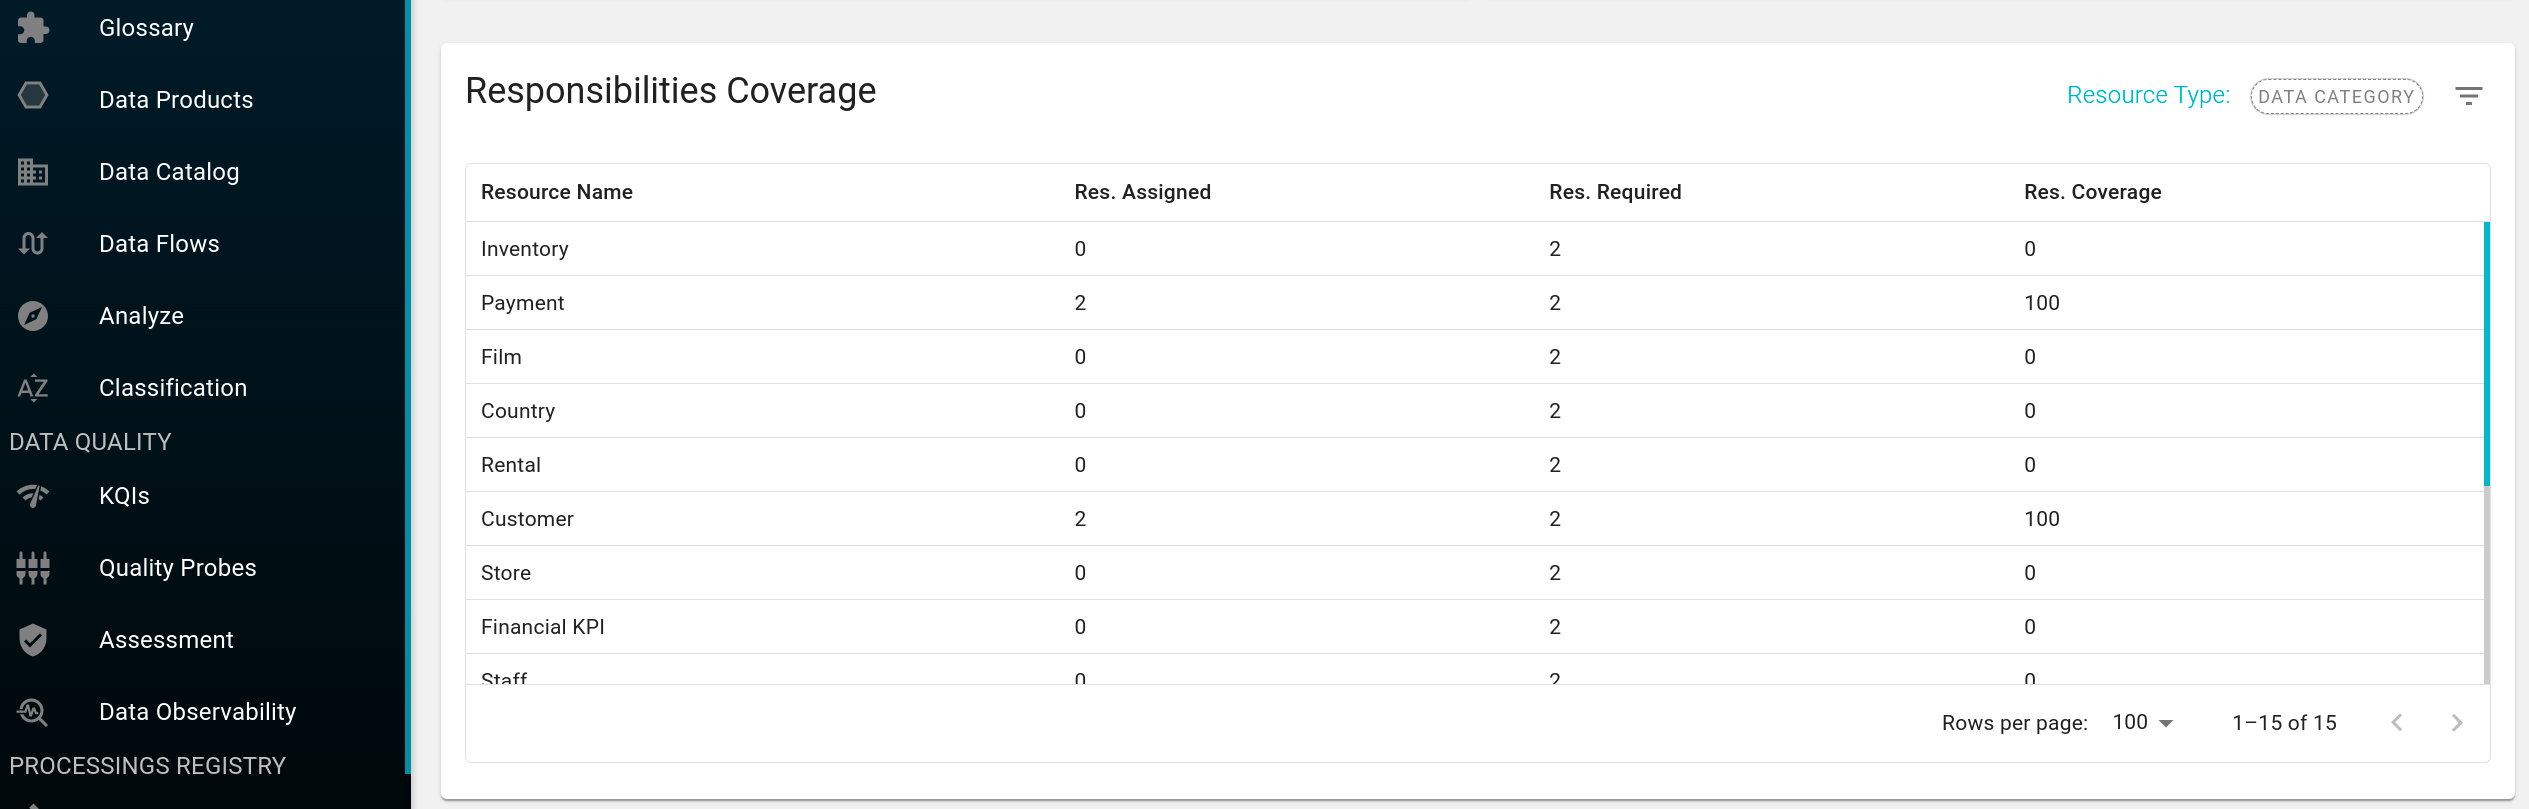
Resource Coverage
The second section presents a table of responsibilities organized by resource type. This table includes:
- Resource name.
- Number of assigned responsibilities.
- Number of requested responsibilities for full coverage.
- Percentage of responsibilities covering the resource.
Users can filter the table by resource type using the filter icon at the top right.
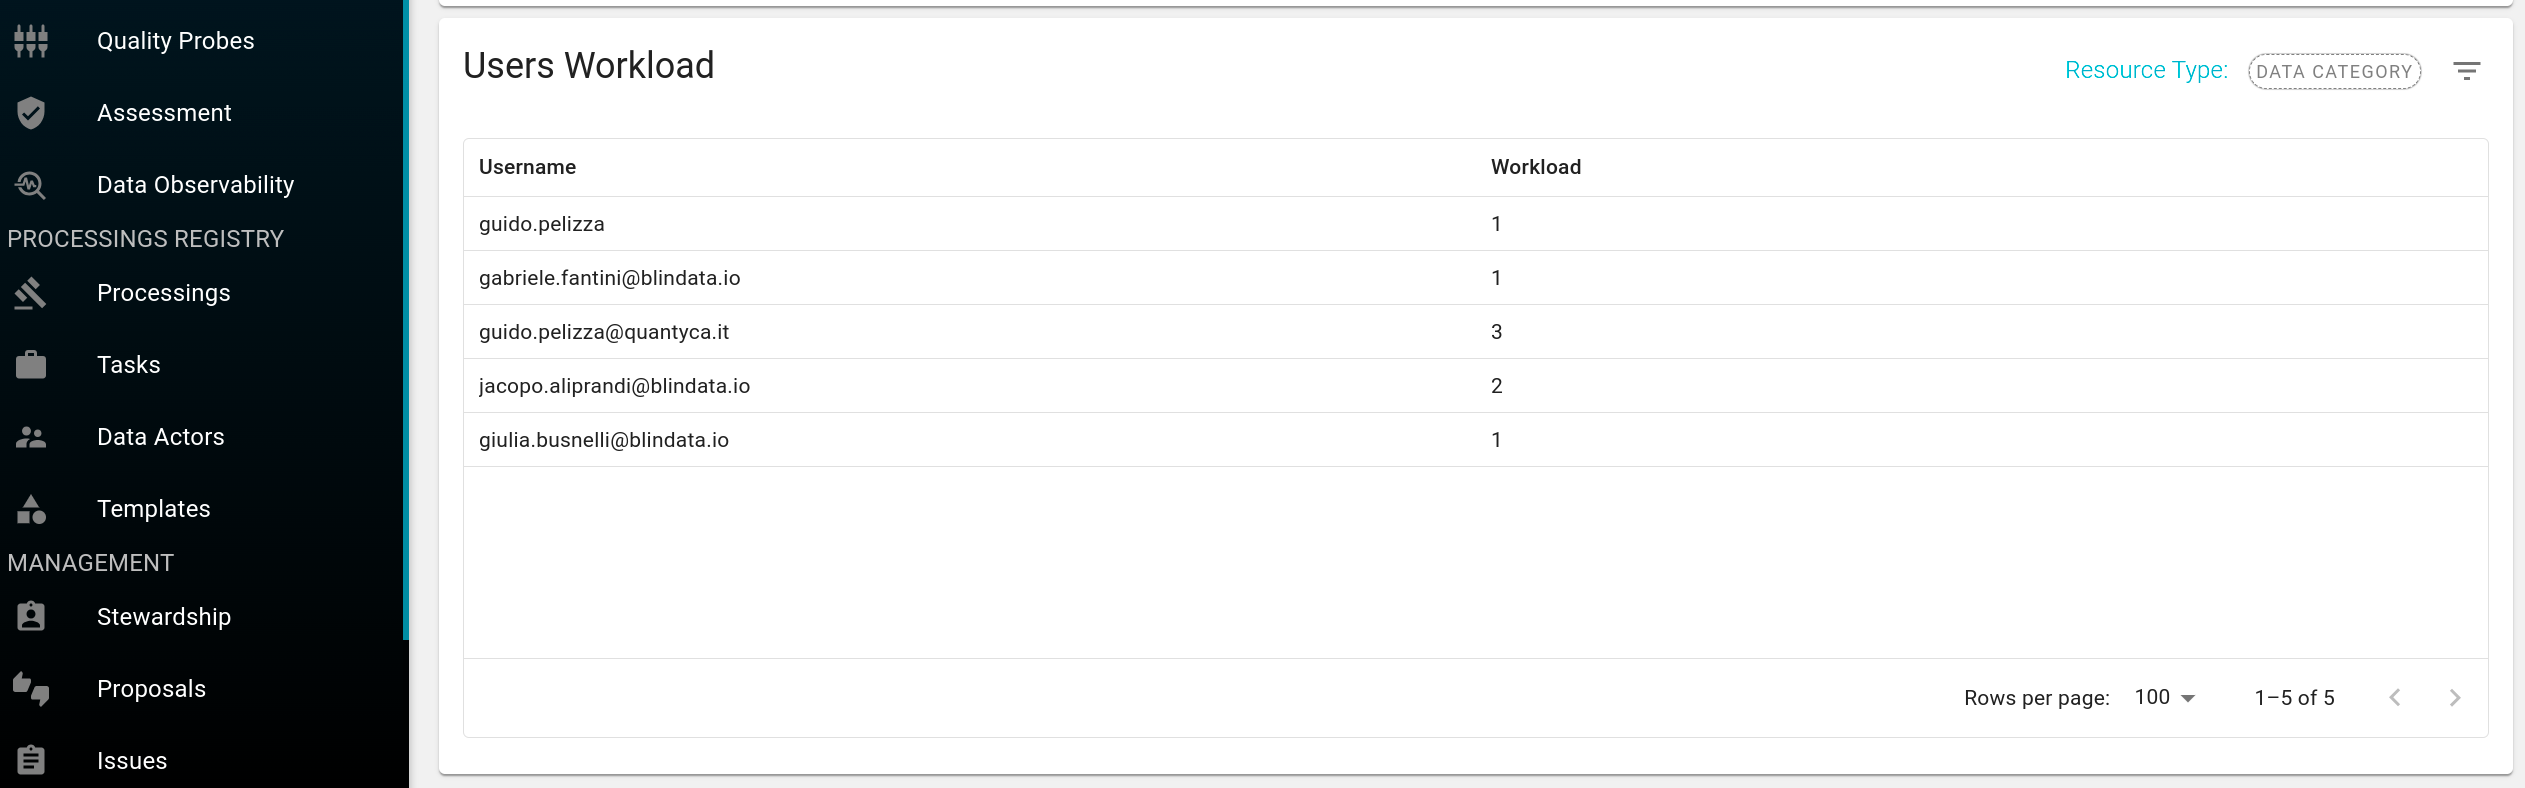
User Workload
The final section displays user workloads, indicating the number of responsibilities assigned to each user. Similar to the previous section, users can filter this table by resource type using the filter icon at the top right.
This dashboard provides valuable insights into responsibility distribution, resource coverage, and user workloads, enabling effective management of responsibilities within Blindata.