Incident and Anomalies Management
Incident Management
Incidents are notified and reported to you via the integrated issue management capabilities of Blindata. You can receive notifications via email, or other channels of your choice. You can also access and manage the incidents via a dashboard or a portal that allows you to view, filter, sort, prioritize, assign, track, and close the incidents. You can also collaborate with other users or teams to share insights and feedback on the incidents.
Incidents List
The Incidents List page serves as a comprehensive log, documenting all historical incidents within Blindata. A visual representation of the incident frequency over the selected time frame and granularity is displayed through a chart, providing users with an overview of incident patterns.
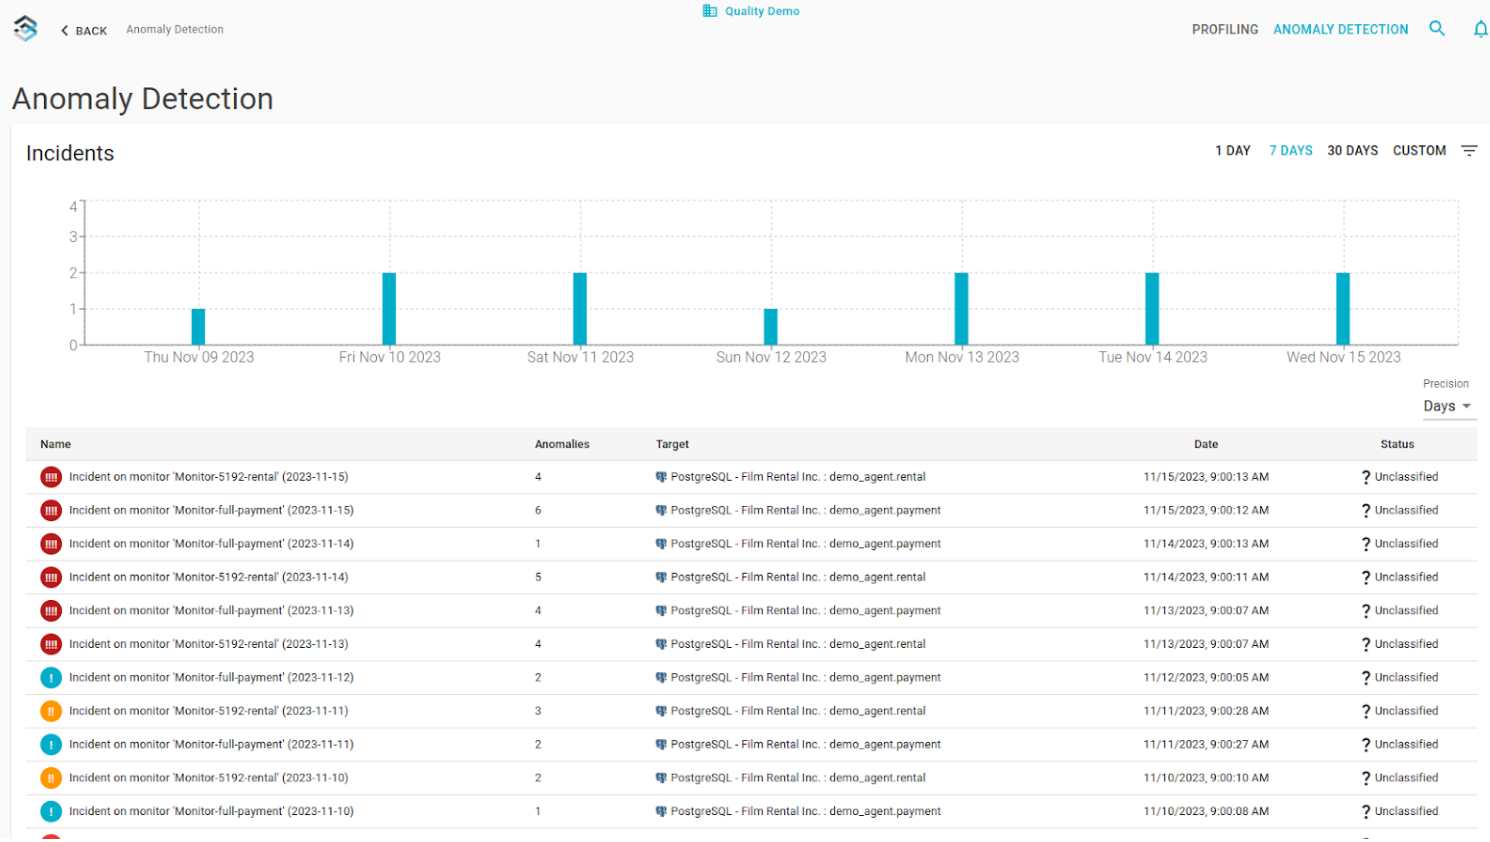
Each incident is accompanied by icons indicating its severity, calculated based on the deviation between the recorded value and the forecasted one. These severity icons offer a quick and intuitive assessment of the impact and significance of each incident, allowing users to efficiently prioritize and address issues. The Incidents List page thus becomes a valuable tool for tracking and analyzing the system’s historical performance, facilitating proactive management of anomalies and deviations from forecasted values.
Incident in Detail
The Incident Detail page provides a granular exploration of specific incidents, offering a detailed breakdown of the anomalies associated with each occurrence. Users can delve into the anomalies that transpired during a particular incident, gaining insights into the nature and characteristics of each anomaly.
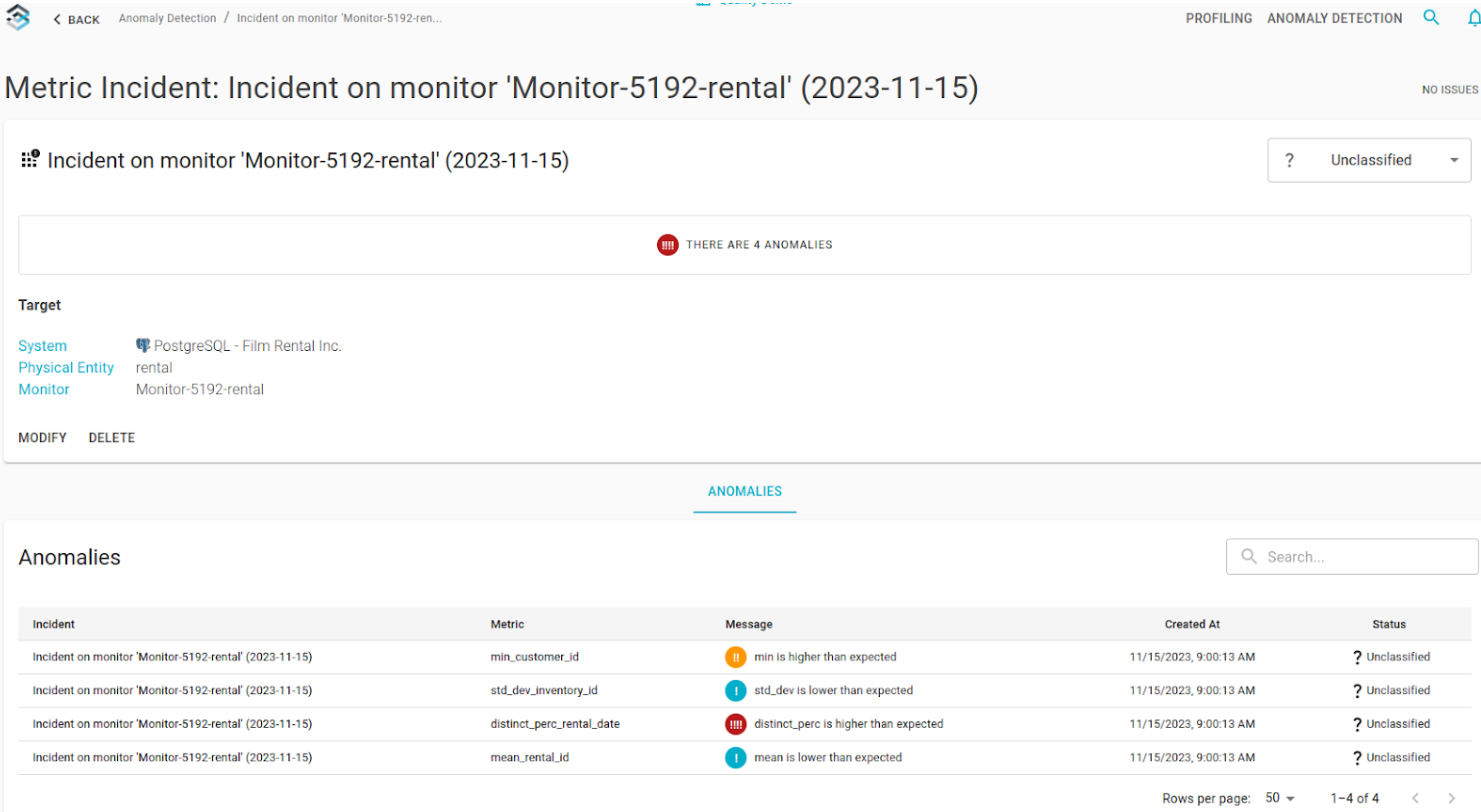
Notably, the severity of the incident is determined by the highest severity level among all its constituent anomalies. This approach allows users to focus on the most critical aspects of the incident and prioritize remediation efforts accordingly. The Incident Detail page enhances the user’s ability to understand and evaluate anomalies by presenting a comprehensive view of the individual components contributing to the overall incident severity.
Anomaly in Detail
The Anomaly Detail page provides a detailed examination of specific anomalies, presenting a visual representation of expected versus real values.
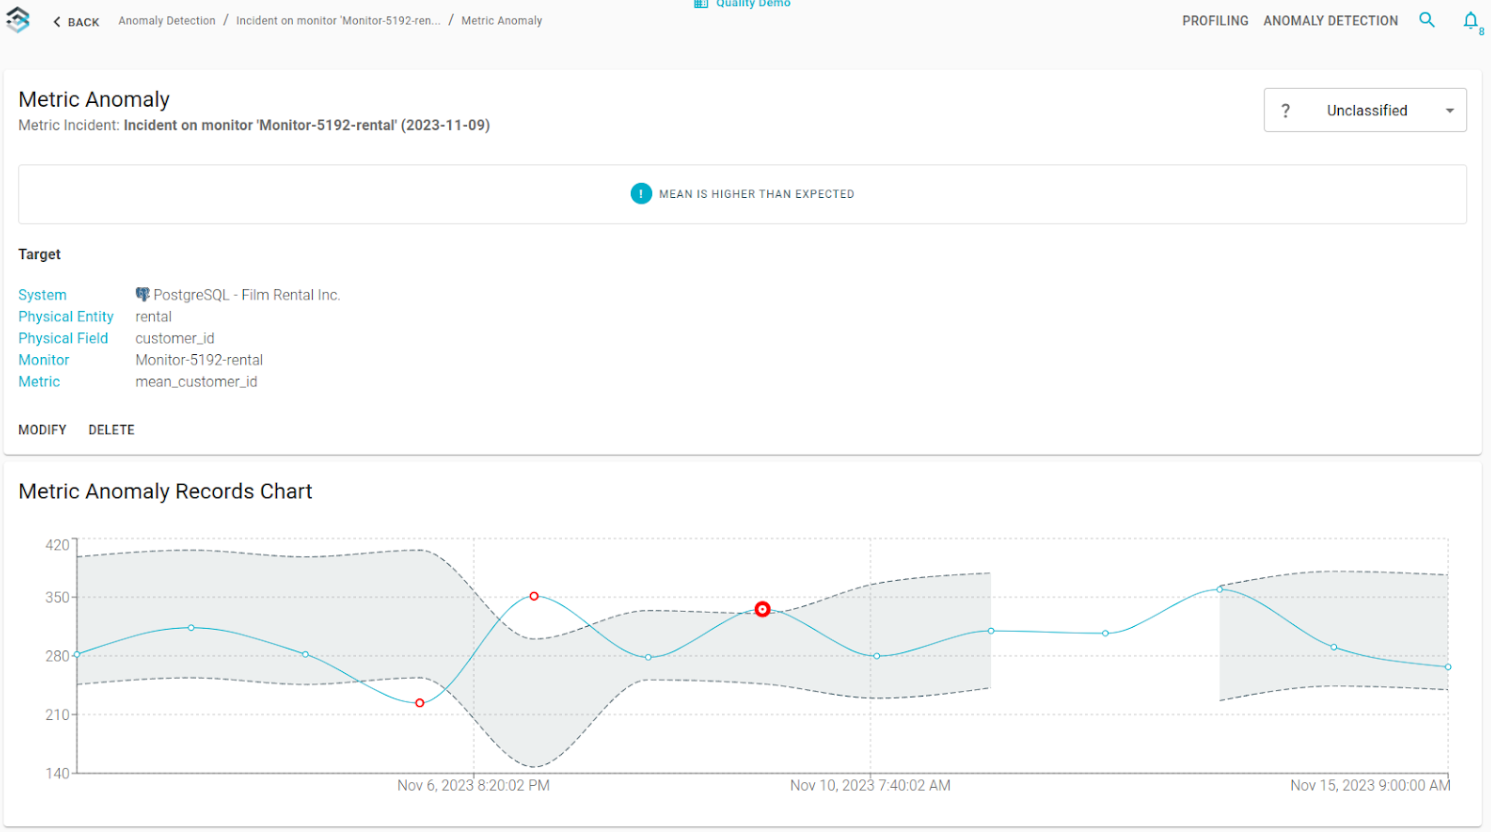
In the chart, the anomaly under investigation is highlighted by a larger red dot, distinguishing it from any potential additional anomalies represented by smaller dots. Gray bands on the chart depict the expected value intervals, offering a clear visual reference for normal behavior. The distinct size and coloration of the dots enhance the user’s ability to identify and focus on the primary anomaly being investigated. This graphical representation, with its emphasis on visual clarity, enables users to quickly grasp the deviation between expected and actual values, facilitating a deeper understanding of the anomaly’s nature and impact.