Profiling Monitor
In Blindata, Monitors serve both to schedule the execution of a profiling SQL query and to define data partitioning logics, for specifying which data of a Physical Entity needs to be profiled. They contain a set of profiling Metrics, representing the profiling data collected over their executions.
How the profiling Monitor works
The following image illustrates the process by which the monitor extracts profiling data from a database table.
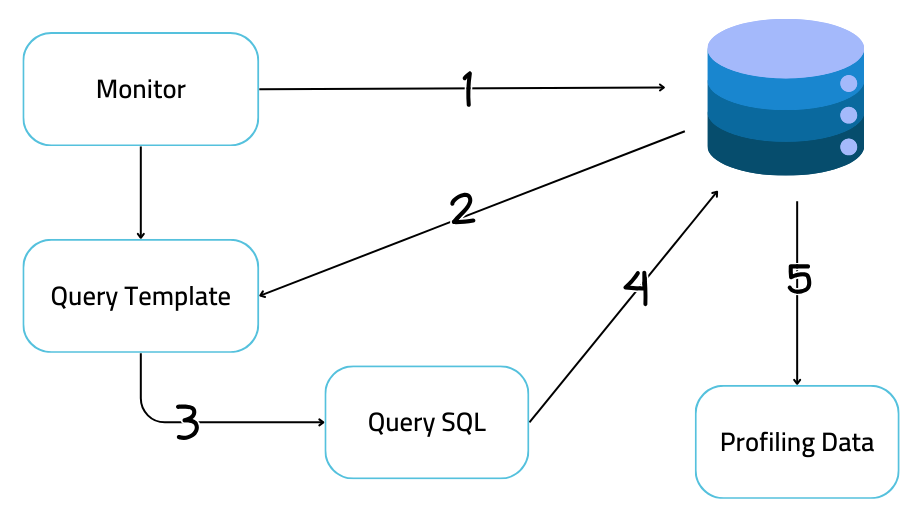
- The profiling Monitor automatically retrieves metadata from the associated database table, including column names and their respective data types. This dynamic process ensures that the profiling SQL query adjusts seamlessly to any changes in the database schema.
- The Monitor’s Query Template is compiled using the metadata retrieved in the step 1.
- Subsequently, a profiling SQL query is generated is generated utilizing the compiled Query Template. Optionally, steps 1, 2 and 3 can be bypassed by assigning a fixed SQL query to the Monitor. This feature proves beneficial when running a highly customized profiling query on the entire table.
- The Monitor then executes the profiling SQL query on the designated database.
- The extracted profiling data is stored in Blindata as profiling Metrics.
How to setup the profiling Monitor
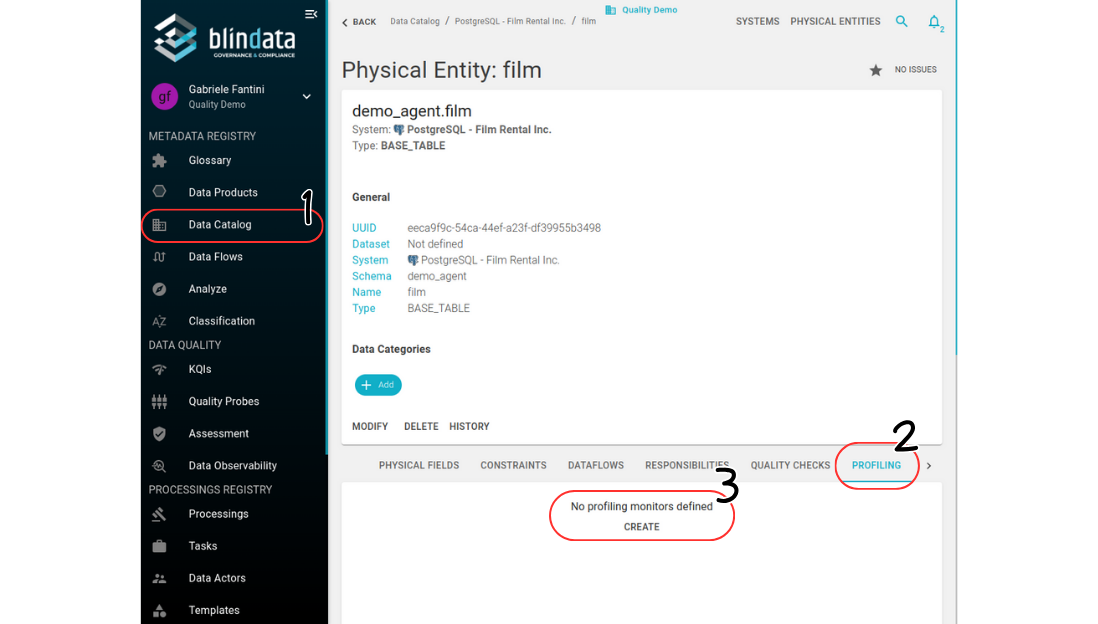
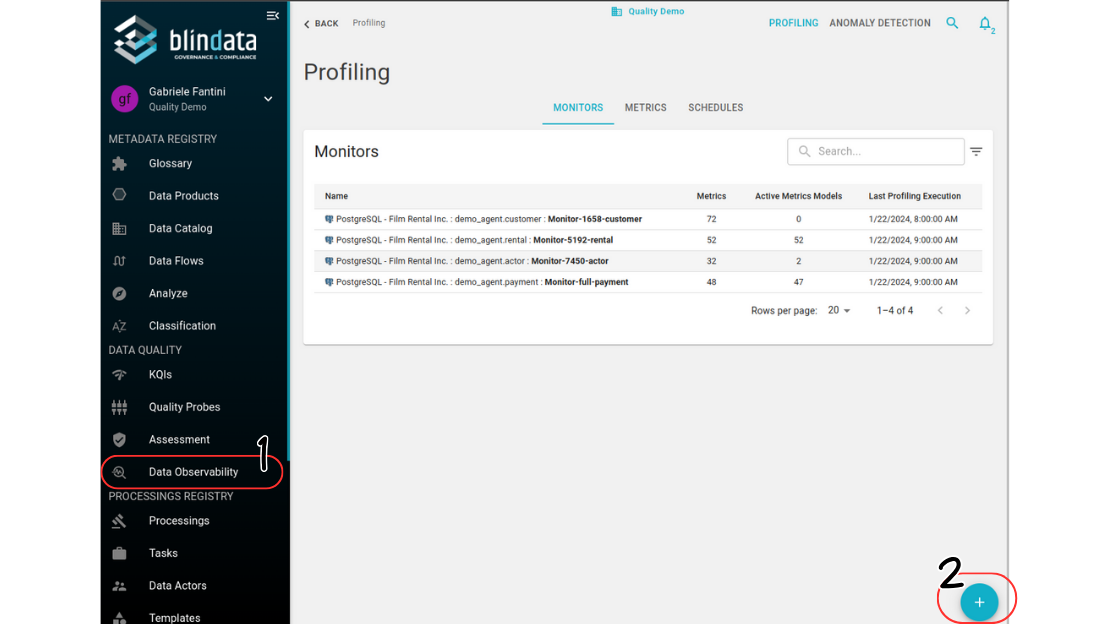
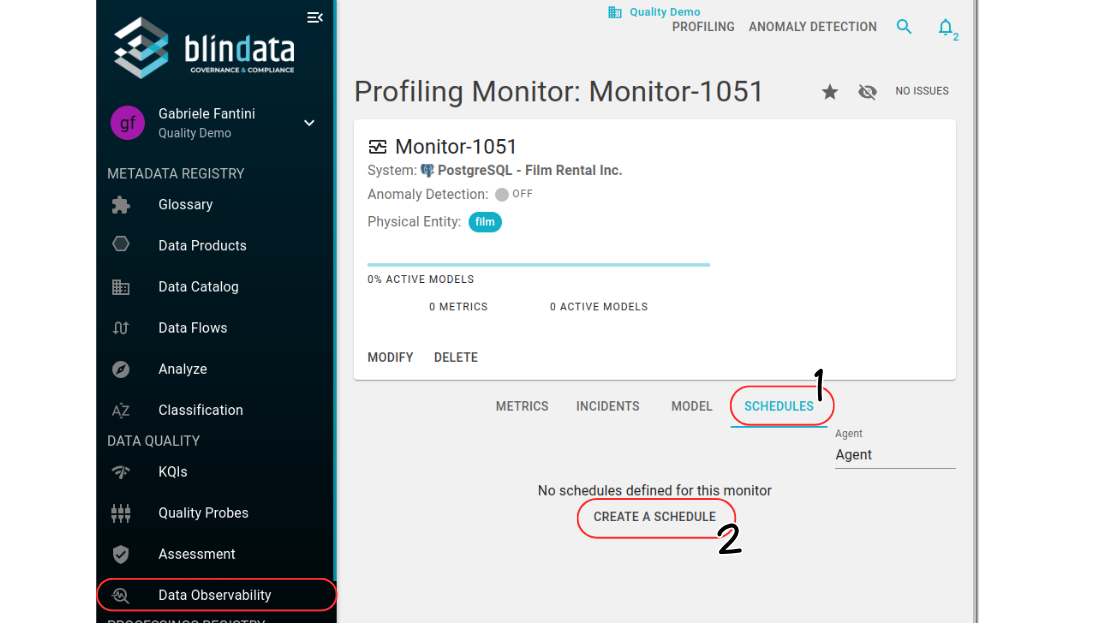
The first step to setup a Monitor is to create the Monitor itself. This can be done from the Profiling section of a Physical Entity or from the Profiling page in the Data Observability section ( Pictures below ).
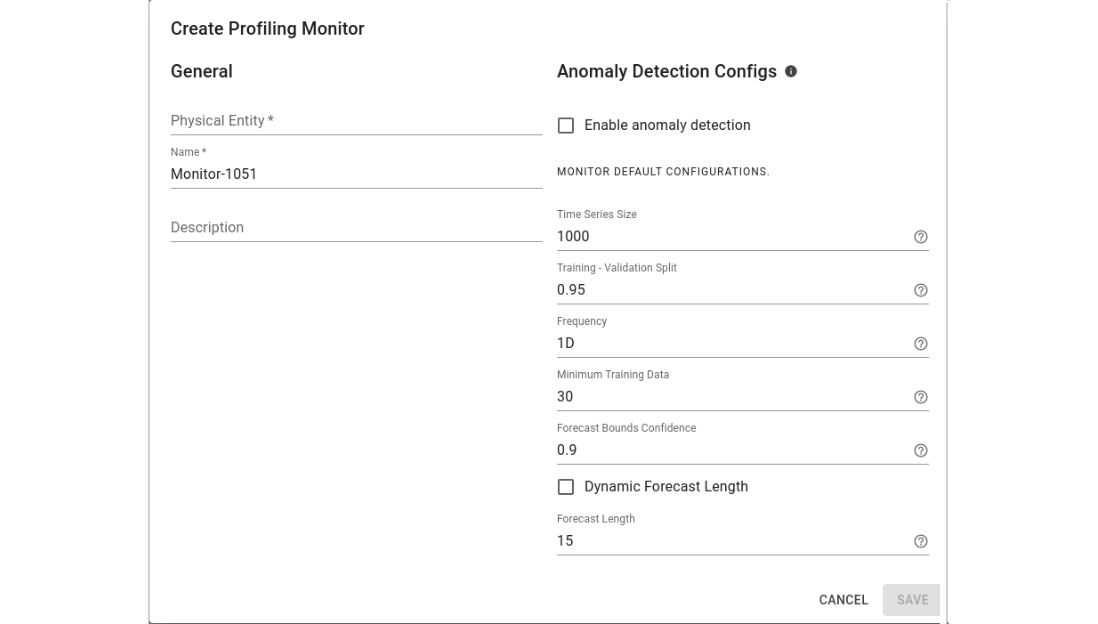
A Monitor must have a name and must be associated to a Physical Entity. During the creation it is also possible to specify the Anomaly Detection configurations for the Monitor ( see here for additional information)
Once the Monitor has been created, an Agent’s job must be created in order to execute it ( more information about Blindata’s Agent can be found here ). This can be done in the Scheduling section of the Monitor ( see the image below ).
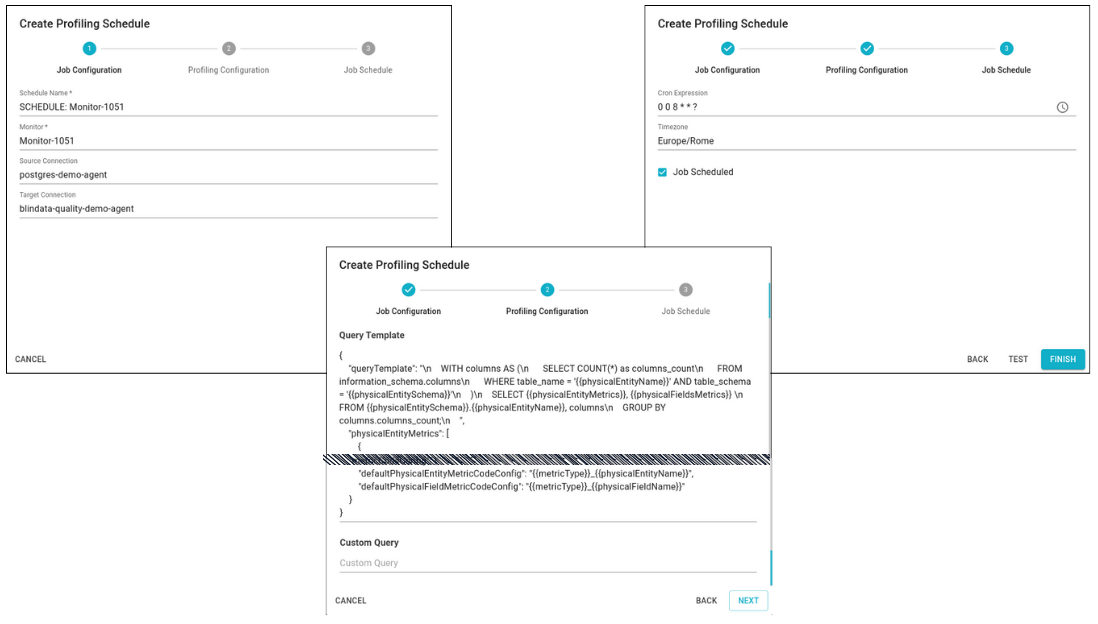
The Profiling Schedule configuration consists in three steps:
- The source and target connections must be defined. The first will be used to connect the Agent to the database, the second to upload the profiling results to the Blindata instance ( more information about Agent’s connections can be found here ).
- The default query template can be modified. Additionally, if a custom query is specified, this will be used instead of the SQL query generated from the query template.
- Scheduling settings for the job can be defined.
Once the Profiling Schedule configuration is completed, it is possible to:
- Test the SQL query generated by the query template ( without actually executing it ).
- Run the profiling to see the gathered metrics ( without uploading them on Blindata ).
- Run the profiling and upload the metrics on Blindata.
How to customize the query template
The query template is a JSON object structured as follows:
- queryTemplate : this field contains the template of the SQL query that will be executed on the database. The names surrounded by the double brackets will be expanded based on the database table metadata and on the structure of others query template’s fields.
{
  "queryTemplate": "
    WITH columns AS (
      SELECT COUNT(*) as columns_count
      FROM information_schema.columns
      WHERE table_name = '{{physicalEntityName}}' AND
       table_schema = '{{physicalEntitySchema}}'
    )
    SELECT {{physicalEntityMetrics}},
     {{physicalFieldsMetrics}}
    FROM {{physicalEntitySchema}}.{{physicalEntityName}},
     columns
    GROUP BY columns.columns_count;"
}
- metricCodeConfig : this field is used to automatically build the profiling Metrics names.
{
  "metricCodeConfig": {
    "defaultPhysicalEntityMetricCodeConfig": "{{metricType}}_{{physicalEntityName}}",
    "defaultPhysicalFieldMetricCodeConfig": "{{metricType}}_{{physicalFieldName}}"
  }
}
- physicalEntityMetrics : this field is used to generate a table-level profiling Metric for each of its array’s objects.
Each array object must have:
- metricType, the type of the profiling Metric.
- metricCode, the code of the Metric that will be used to upload the profiling records to the correct Metric in Blindata.
The metric code can be automatically generated using the
metricCodeConfigor manually defined inside themetricFunction - metricFunction, the SQL function to gather the profiling Metric.
{
  "physicalEntityMetrics": [
    {
      "metricType": "rows_count",
      "metricCode": "defaultPhysicalEntityMetricCodeConfig",
      "metricFunction": "COUNT(*) AS {{metricCode}}"
    },
    {
      "metricType": "columns_count",
      "metricCode": "defaultPhysicalEntityMetricCodeConfig",
      "metricFunction": "columns.columns_count AS {{metricCode}}"
    }
  ]
}
- physicalFieldsMetrics: this field is used to build the SQL functions that will be used to extract the Metrics for each Physical Field ( table column ). The field contains 4 generic data types ( date, string, number and bool ), which can be expanded or removed. For each generic data type a list of Metrics is defined in the same manner of the table-level Metrics.
{
  "physicalFieldsMetrics": {
    "date": [
      {
        "metricType": "null_count",
        "metricCode": "defaultPhysicalFieldMetricCodeConfig",
        "metricFunction": "count(*) - count({{physicalFieldName}}) AS {{metricCode}}"
      },
      {
        "metricType": "null_perc",
        "metricCode": "defaultPhysicalFieldMetricCodeConfig",
        "metricFunction": "(count(*) - count({{physicalFieldName}})) / CAST(count(*) as decimal(10,3)) AS {{metricCode}}"
      },
      {
        "metricType": "max",
        "metricCode": "defaultPhysicalFieldMetricCodeConfig",
        "metricFunction": "MAX({{physicalFieldName}}) AS {{metricCode}}"
      },
      {
        "metricType": "min",
        "metricCode": "defaultPhysicalFieldMetricCodeConfig",
        "metricFunction": "MIN({{physicalFieldName}}) AS {{metricCode}}"
      },
      {
        "metricType": "distinct_count",
        "metricCode": "defaultPhysicalFieldMetricCodeConfig",
        "metricFunction": "COUNT(DISTINCT {{physicalFieldName}}) AS {{metricCode}}"
      },
      {
        "metricType": "distinct_perc",
        "metricCode": "defaultPhysicalFieldMetricCodeConfig",
        "metricFunction": "(COUNT(DISTINCT {{physicalFieldName}}) / CAST(COUNT(*) as decimal(10,3))) AS {{metricCode}}"
      }
    ],
    "string": [
      {
        "metricType": "null_count",
        "metricCode": "defaultPhysicalFieldMetricCodeConfig",
        "metricFunction": "count(*) - count({{physicalFieldName}}) AS {{metricCode}}"
      },
      {
        "metricType": "null_perc",
        "metricCode": "defaultPhysicalFieldMetricCodeConfig",
        "metricFunction": "(count(*) - count({{physicalFieldName}})) / CAST(count(*) as decimal(10,3)) AS {{metricCode}}"
      },
      {
        "metricType": "max",
        "metricCode": "defaultPhysicalFieldMetricCodeConfig",
        "metricFunction": "MAX(LENGTH({{physicalFieldName}})) AS {{metricCode}}"
      },
      {
        "metricType": "min",
        "metricCode": "defaultPhysicalFieldMetricCodeConfig",
        "metricFunction": "MIN(LENGTH({{physicalFieldName}})) AS {{metricCode}}"
      },
      {
        "metricType": "mean",
        "metricCode": "defaultPhysicalFieldMetricCodeConfig",
        "metricFunction": "AVG(LENGTH({{physicalFieldName}})) AS {{metricCode}}"
      },
      {
        "metricType": "std_dev",
        "metricCode": "defaultPhysicalFieldMetricCodeConfig",
        "metricFunction": "STDDEV(LENGTH({{physicalFieldName}})) AS {{metricCode}}"
      },
      {
        "metricType": "distinct_count",
        "metricCode": "defaultPhysicalFieldMetricCodeConfig",
        "metricFunction": "COUNT(DISTINCT {{physicalFieldName}}) AS {{metricCode}}"
      },
      {
        "metricType": "distinct_perc",
        "metricCode": "defaultPhysicalFieldMetricCodeConfig",
        "metricFunction": "(COUNT(DISTINCT {{physicalFieldName}}) / CAST(COUNT(*) as decimal(10,3))) AS {{metricCode}}"
      }
    ],
    "number": [
      {
        "metricType": "null_count",
        "metricCode": "defaultPhysicalFieldMetricCodeConfig",
        "metricFunction": "count(*) - count({{physicalFieldName}}) AS {{metricCode}}"
      },
      {
        "metricType": "null_perc",
        "metricCode": "defaultPhysicalFieldMetricCodeConfig",
        "metricFunction": "(count(*) - count({{physicalFieldName}})) / CAST(count(*) as decimal(10,3)) AS {{metricCode}}"
      },
      {
        "metricType": "max",
        "metricCode": "defaultPhysicalFieldMetricCodeConfig",
        "metricFunction": "MAX({{physicalFieldName}}) AS {{metricCode}}"
      },
      {
        "metricType": "min",
        "metricCode": "defaultPhysicalFieldMetricCodeConfig",
        "metricFunction": "MIN({{physicalFieldName}}) AS {{metricCode}}"
      },
      {
        "metricType": "mean",
        "metricCode": "defaultPhysicalFieldMetricCodeConfig",
        "metricFunction": "AVG({{physicalFieldName}}) AS {{metricCode}}"
      },
      {
        "metricType": "std_dev",
        "metricCode": "defaultPhysicalFieldMetricCodeConfig",
        "metricFunction": "STDDEV({{physicalFieldName}}) AS {{metricCode}}"
      },
      {
        "metricType": "distinct_count",
        "metricCode": "defaultPhysicalFieldMetricCodeConfig",
        "metricFunction": "COUNT(DISTINCT {{physicalFieldName}}) AS {{metricCode}}"
      },
      {
        "metricType": "distinct_perc",
        "metricCode": "defaultPhysicalFieldMetricCodeConfig",
        "metricFunction": "(COUNT(DISTINCT {{physicalFieldName}}) / CAST(COUNT(*) as decimal(10,3))) AS {{metricCode}}"
      }
    ],
    "bool": [
      {
        "metricType": "null_count",
        "metricCode": "defaultPhysicalFieldMetricCodeConfig",
        "metricFunction": "count(*) - count({{physicalFieldName}}) AS {{metricCode}}"
      },
      {
        "metricType": "null_perc",
        "metricCode": "defaultPhysicalFieldMetricCodeConfig",
        "metricFunction": "(count(*) - count({{physicalFieldName}})) / CAST(count(*) as decimal(10,3)) AS {{metricCode}}"
      }
    ]
  }
}
- dataTypesMapping : this field is used to map the database-specific data types into the generic ones that are declared in
physicalFieldsMetrics. This section is configured for PostgreSQL by default and must be updated/checked when choosing another database technology.
{
  "dataTypesMapping": {
    "string": ["CHAR", "VARCHAR", "LONGVARCHAR", "text"],
    "date": [
      "DATE",
      "TIME",
      "TIMESTAMP",
      "TIME_WITH_TIMEZONE",
      "TIMESTAMP_WITH_TIMEZONE"
    ],
    "number": [
      "TINYINT",
      "SMALLINT",
      "INTEGER",
      "BIGINT",
      "FLOAT",
      "REAL",
      "DOUBLE",
      "NUMERIC",
      "DECIMAL",
      "ROWID"
    ],
    "bool": ["bool", "BOOLEAN"]
  }
}
Profiling and data partitioning
A Monitor has the capability to run the profiling SQL query across either the entire set of table rows or a specific subset of rows.
This can be done by modifying the WHERE clause of the queryTemplate.
By default the template comes without a WHERE, so a full scan profiling over all table records is performed.
Important!
Ensure that if a WHEREclause is configured for incremental scanning over time,
the Monitor scheduling time must be synchronized to prevent skipping data.