Profiling Metric
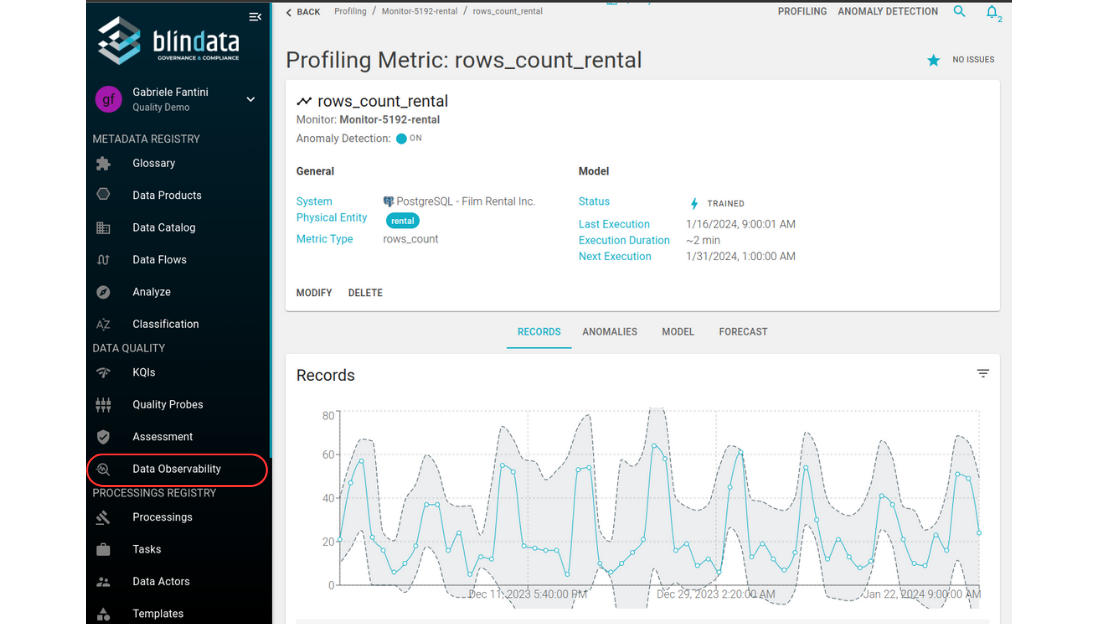
In Blindata, a single Metric is a container for a series of data profiling measurements ( Profiling Records ) done by the associated Monitor . A Metric can be calculated at table level, like the counts of the columns or the total number of rows, or it can be calculated at column level, like the null count of a single column.
How to create a Profiling Metric
A data profiling Metric can be generated through two methods:
- Automatic creation occurs when the Monitor attempts to upload Profiling Records to Blindata and does not locate a corresponding metric code. In such cases, a new Metric is generated with the corresponding code.
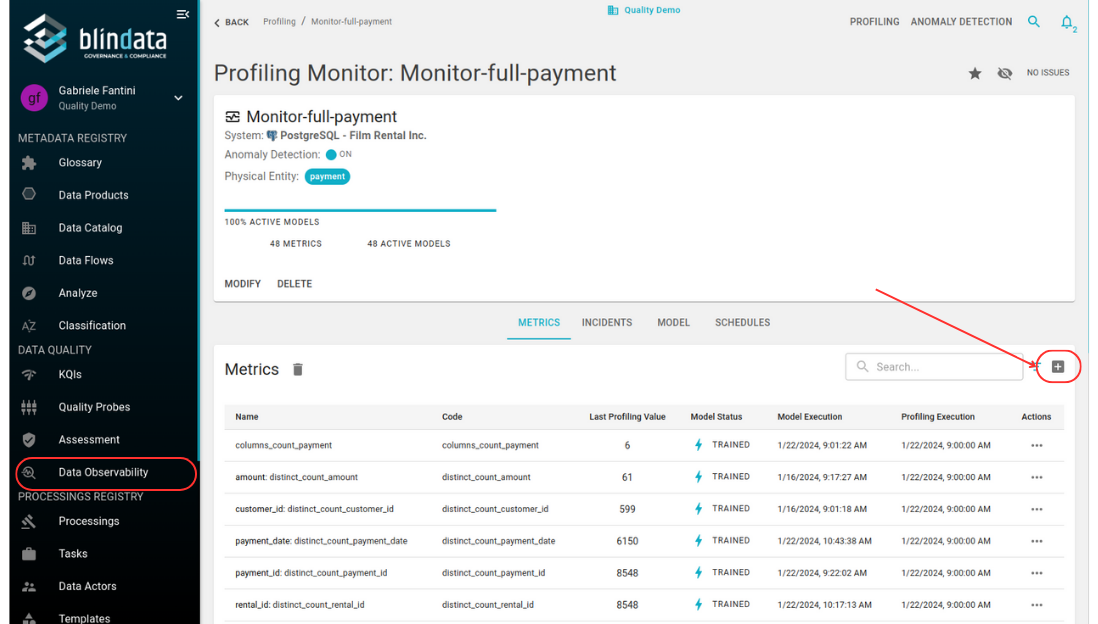
- Manual creation is possible on the Monitor detail page.
How to visualize Profiling Data
Profiling Data can be visualized:
-
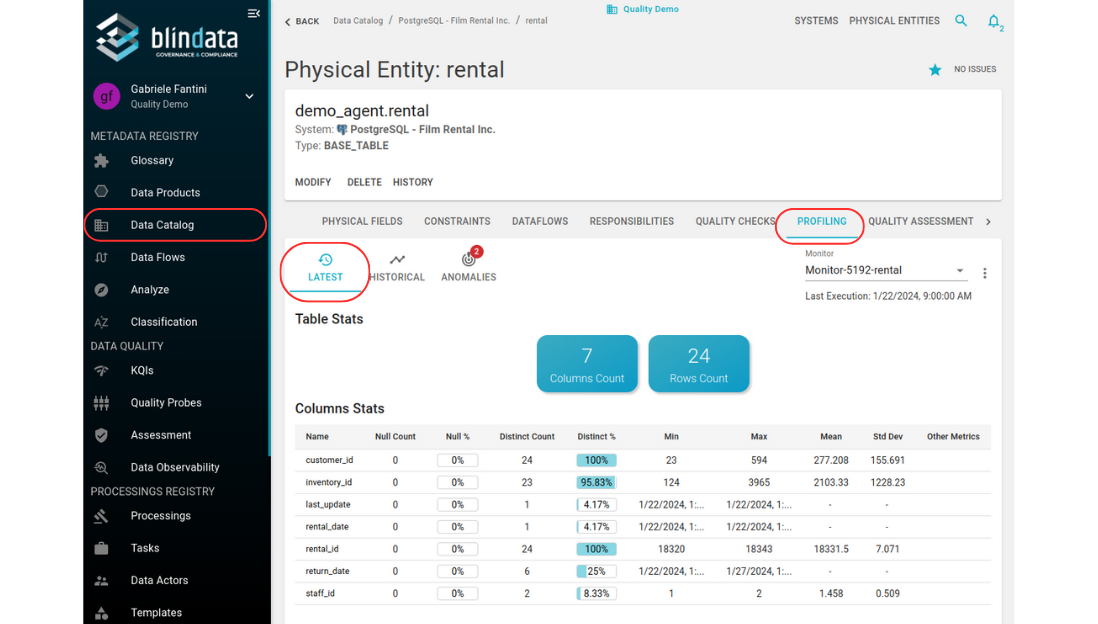
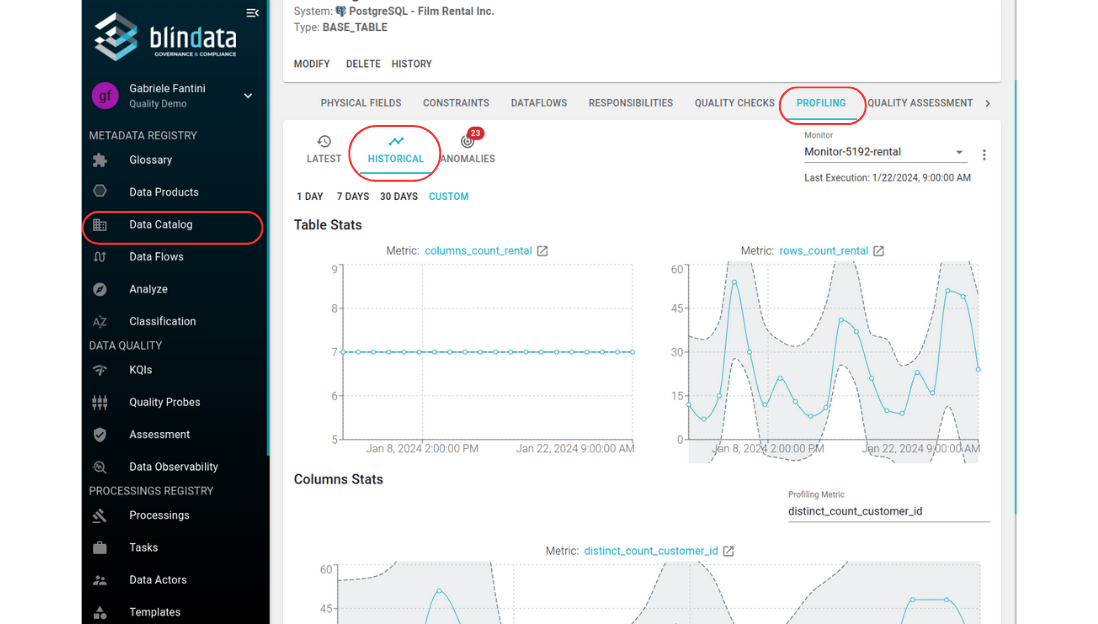
Directly in the Physical Entity detail page, under the Profiling section. In its “Latest” subsection there is a snapshot of the Monitor last execution, which displays the last Metrics values. In its “Historical” subsection it is possible to visualize the values of Metrics over a given range of time.
-
In the detail page of the Metric, where a more detailed chart of the Metric’s Profiling Records is visible.