Key Quality Indicators
Overview
The Blindata Data Quality module leverages Key Quality Indicators (KQIs) to continuously monitor and evaluate the quality of your data. Each KQI measures a specific dimension of data quality by producing a metric: a numerical value that reflects the current state of the data.
Some common examples include:
- The number of events collected in one hour, representing the freshness of the data.
- The number of records with a blank field, measuring completeness.
- A calculated field whose value deviates from expected source values, indicating consistency issues.
Once you have defined and measured a KQI, the Blindata framework derives two synthetic indicators to simplify analysis:
- Score – A value between 0 and 100 that expresses how the observed KQI metric compares to its expected value.
- Semaphore – A color-coded traffic light (green, yellow, red) assigned based on the score and your defined thresholds, offering a quick visual summary of data quality.
These indicators provide both quantitative and intuitive insights into the health of your data.
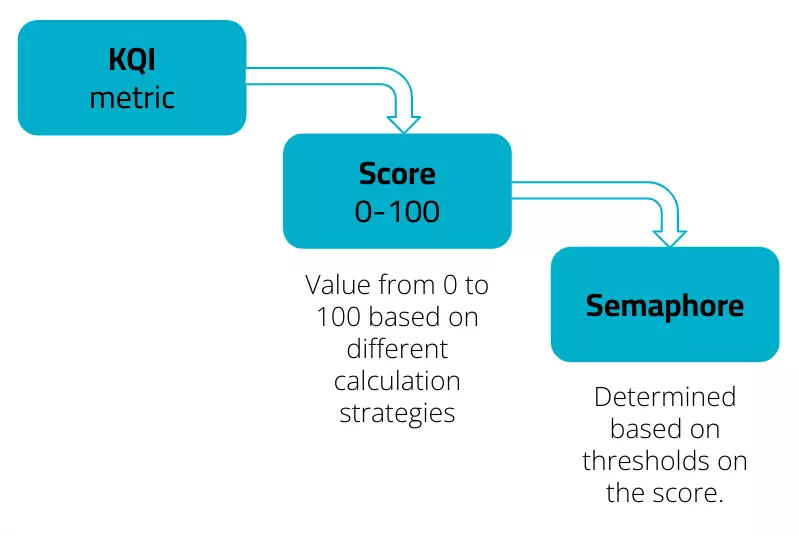
Figure 1: Score and Semaphore indicators provide a quick overview of data quality.
Blindata Data Quality can supports both technical and business-process related checks. Technical checks may focus on structural aspects like data freshness, volume and referential integrity. Business checks validate semantic aspects such as data completeness, accuracy, business rule compliance, and regulatory requirements. You can organize these using suites and metadata, and control their visibility by publishing them (connected to physical assets) or keeping them as drafts for testing and iteration.
Note
To make the most of KQIs, you should have a clear understanding of your data sources and the specific business rules that define data quality for your organization. Identifying what “good data” means for your use case is the first step.
Selecting the Score strategy
The score is a value between 0 and 100 that represents how well a Key Quality Indicator (KQI) aligns with its target. In other words, it measures the “goodness” of a KQI relative to a reference value.
The Blindata Data Quality module provides different strategies to calculate this score, depending on the type of quality check you are performing.
| Strategy | Description | Example |
|---|---|---|
| Error Percentage | The metric represents the number of errors found. The score is the percentage of correct elements: ((totalElements - metric) / totalElements) * 100. The fewer the errors, the higher the score. |
If you analyze 200 records (totalElements) and find 10 with errors (metric), the score is ((200 - 10) / 200) * 100 = 95. |
| Percentage Deviation | Calculates the score based on the deviation from a target value using the formula: (1 - abs(totalElements - metric) / totalElements) * 100. totalElements is the expected value, and metric is the observed value. |
If you expect 5,000 daily transactions (totalElements) and the actual metric is 4,900 (metric), the score is (1 - abs(5000 - 4900) / 5000) * 100 = 98. |
| Minimum | Use this when your metric must meet or exceed a minimum threshold. If the metric is >= the expected value, the score is 100. If it falls below a minimum acceptable value, the score is 0. Values in between are scored proportionally. | If you expect at least 1,000 events per hour, and your minimum acceptable value is 800, a metric of 1,200 scores 100. A metric of 700 scores 0. A metric of 900 would receive a partial score. |
| Maximum | The inverse of “Minimum.” A score of 100 is assigned if the metric is <= the expected value. The score is 0 if it exceeds a maximum acceptable value. Intermediate values are normalized. | If your system should have no more than 5 failed logins per minute (expected), and the maximum acceptable is 10, a metric of 3 scores 100. A metric of 12 scores 0. |
| Distance | This evaluates how close the metric is to an expected value within a defined range. If the metric equals the expected value, the score is 100. If it’s outside the min/max bounds, the score is 0. | If you expect 50 new sign-ups (expected) with an acceptable range of 40-60, a metric of 50 scores 100. A metric of 45 gets a high score, while a metric of 35 scores 0. |
| External | With the External strategy, you can manually enter a score from 0 to 100. This is ideal for qualitative assessments or when the score comes from an external system that cannot be automated. | A data steward might manually review 10 high-value customer records for accuracy and assign a score of 85.5 based on their qualitative judgment. |
Configuring the semaphores thresholds
Based on the score and the alert thresholds you define, each KQI is assigned a visual traffic light (green, yellow, or red). This semaphore allows you to instantly assess the status of a KQI at a glance.
In addition to providing a quick summary, the semaphore is also your tool for triggering notifications, so you can act on data quality issues as they arise.
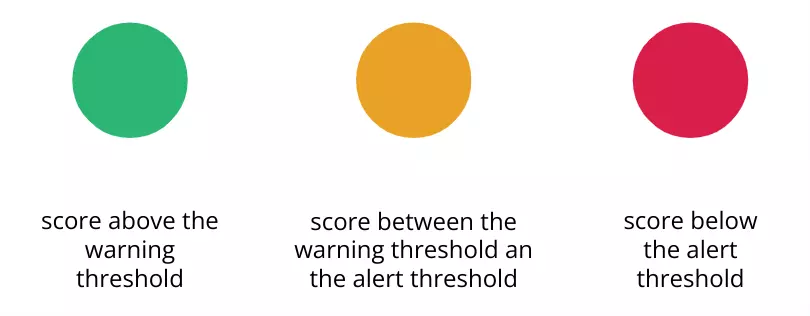 Figure 2: The meaning of each semaphore color and its relation to monitoring thresholds.
Each scoring strategy and its thresholds can be configured to follow different patterns. The diagram below illustrates how you can map traffic light colors to score ranges.
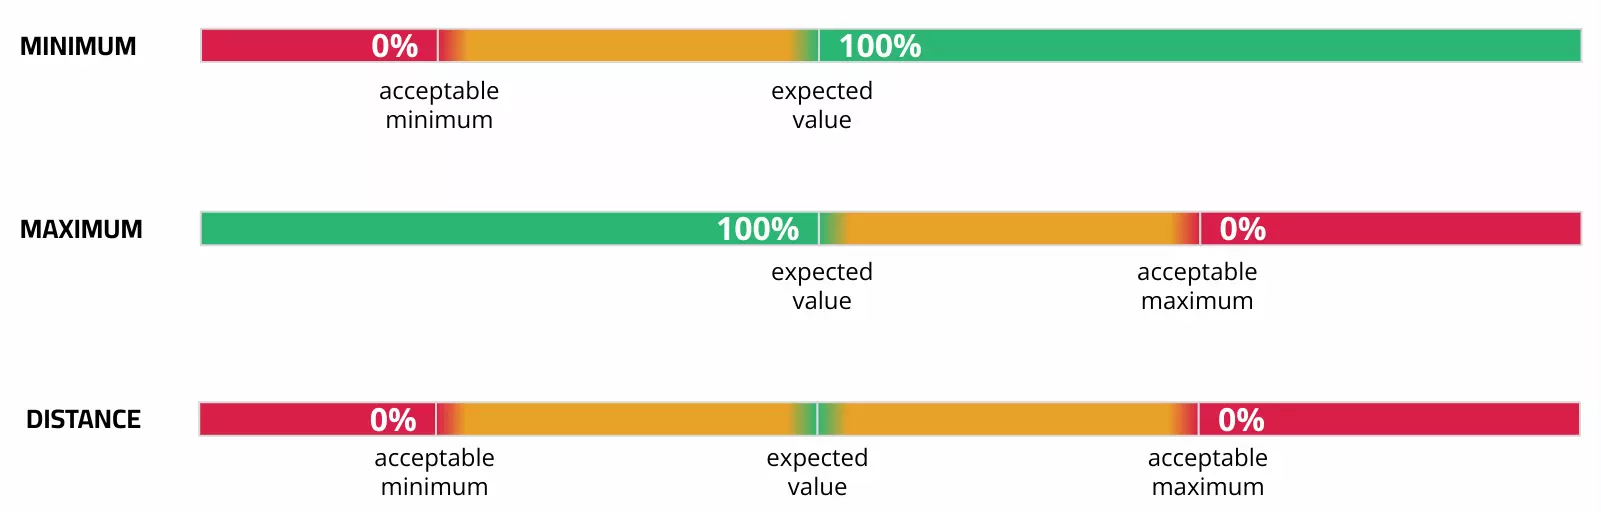 Figure 3: An example of mapping score percentages to semaphore colors based on defined thresholds.
Practical Use Case: Ensuring Product Description Completeness
Let’s walk through a complete example to see how these concepts work together. Imagine you want to ensure the description field in your Products table is rarely empty.
- Define the KQI: You create a KQI named “Product Description Completeness.”
- Choose the Metric: The metric will be the number of records where the
descriptionfield isNULLor blank. - Select a Score Strategy: You choose the Error Percentage strategy because you want to minimize the number of errors (blank descriptions). Here,
totalElementsis the total number of product records, andmetricis the count of records with a missing description. - Set Thresholds for the Semaphore: You configure the thresholds to reflect your business requirements:
- Green (Score 99-100): Excellent. Less than 1% of product descriptions are missing.
- Yellow (Score 95-98.9): Warning. Between 1% and 5% of product descriptions are missing. An automated warning is sent to the data team.
- Red (Score 0-94.9): Critical. More than 5% of product descriptions are missing. An urgent alert is triggered for immediate investigation.
- Review and Act: On your dashboard, this KQI shows a Red semaphore. This immediately tells you that the quality standard has been breached. The triggered alert notifies the data stewardship team to investigate and remediate the missing data.
Next Steps
Now that you understand the concepts behind Key Quality Indicators, you are ready to put them into practice.