Probes Execution
Command Line Execution Mode
The quality probes, defined as illustrated in the previous paragraphs, can be performed by the Blindata Agent suitably launched from the command line.
The Blindata Data Quality Agent requires two YAML configuration files as input. The first file contains the definition of all the connections used by the probes. The second file is dedicated to the actual definition of the queries for the collection of quality metrics, i.e. the probes of a project.
From the Blindata platform it is possible to download these configuration files, already correctly formatted. You access the functionality of download from the buttons highlighted in the following figures. You can export the connections YAML file, the YAML file related to a project in its current version and the YAML file of a specific tag of project.
After downloading the files you can run Blindata Data Quality Agent with the following command (to be run where the agent was installed):
java
-Dloader.path=path/to/blindata-quality-agent/lib/
-jar blindata-quality-agent-<VERSION>.jar
--agent.config.connections=path/to/blindata-quality-agent/connections-config.yml
--agent.config.probes=path/to/blindata-quality-agent/probes-config.yml
--spring.profiles.active=output-csv,output-blindata
The files to specify for the properties agent.config.connections and agent.config.probes are those that can be downloaded from the Blindata platform, respectively from the connections page and from the project detail page.
Note
The connection configuration file is optional as it is possible to integrate the definition of all the necessary connections into the project configuration file. By clicking on the download button in the detail page of a project it will be explicitly asked whether or not the file to be downloaded must also contain the definition of the connections for that project.
Execution Using Blindata Agent
Probes can also be executed and scheduled on the Blindata Agent directly from the platform, without the need to access the machine on which the agent is installed.
Testing a Probe or a Project
It is possible to test:
- a project, i.e. all probes defined in the project in their current version
- a tag, i.e. of all the probes present in the tag in their specific version
- a single probe (while being created and edited or from the detail page)
This functionality is useful during the development phases to verify the functioning of the probes or verify the extracted numbers.
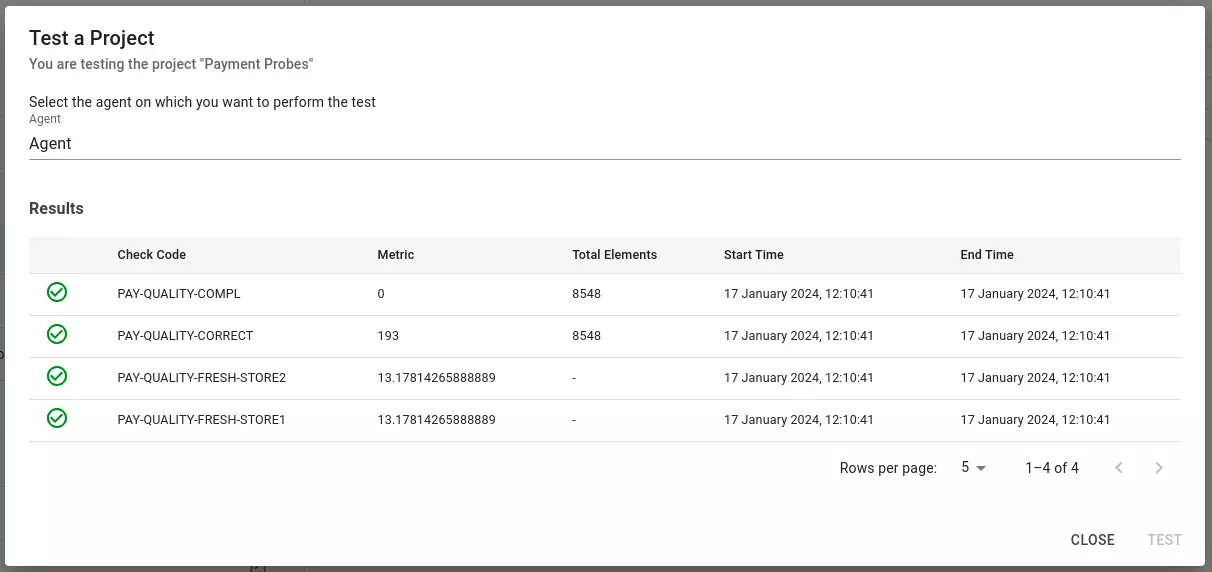
You can test a project from its detail page, in the section relating to the probes defined on it. The “Run All Probes” button opens the modal relating to the project test, with the possibility of choosing which agent, among those available, to run the test on. Once the “Test” button has been pressed, all the probes defined in the project, in the current version, will be executed.
The result is shown in the table formed by:
- Status icon: indicates whether the execution was successful or not.
- Check Code: the codes of all the checks on which the test was performed
- Metric: the value extracted from the execution
- Total Element: shows, if defined, the total number of items checked.
- Start Time / End Time: temporal information on the start and end date of the execution.
The table is similar also for the tests of a tag or a single probe.
The test of a tag it is possible from its detail page, as seen for the project. Also in this case, the “Run All Probes” button opens the relative test window, where all the probes defined in the tag in question are run.
The single probe test can be performed from two different points:
- During the creation/modification of the probe. This functionality allows the probe to be tested while it is being defined, allowing the user to check the resulting metrics and correct operation.
- In the detail page of the probe among the actions that are made available
Again, when testing a single probe, the result will be similar to what we have already seen for projects and tags.
Scheduling a Project
It is then possible to schedule a project, so that its probes are performed periodically. To do this you must have created a tag for the project. To access the function, go to the project detail page in the “Schedule” tab. From here, after selecting the agent on which you want to store the schedule and then run the project probes, you can create a new schedule using the “Create a Schedule” button.
The information required to create a new schedule is as follows:
- Target: the tag, i.e. the specific state of the project that you want to schedule. Once the tag is selected, the job name will automatically be created as: “Project Name + Tag Name”.
- Cron expression: the time expression that indicates when the project should be executed (every hour, every minute etc…). A helper tool is available to help you create one in a guided way.
- Timezone: the timezone to which the cron expression must refer.
- Connection: the connection to Blindata, in order to be able to upload the results of the executions on the platform.
After defining a schedule for the project, the same tab will show the detailed information and the history of the executions, from which it is possible to access the logs.