Dashboards
The “Dashboards” section allows you to view summary reports on residual risks. The reports are useful for validating the effectiveness of the existing control systems and for identifying which data assets are most exposed to risks that are not mitigated by the current quality control measures implemented - i.e. which interventions need to be prioritized from a data quality perspective.
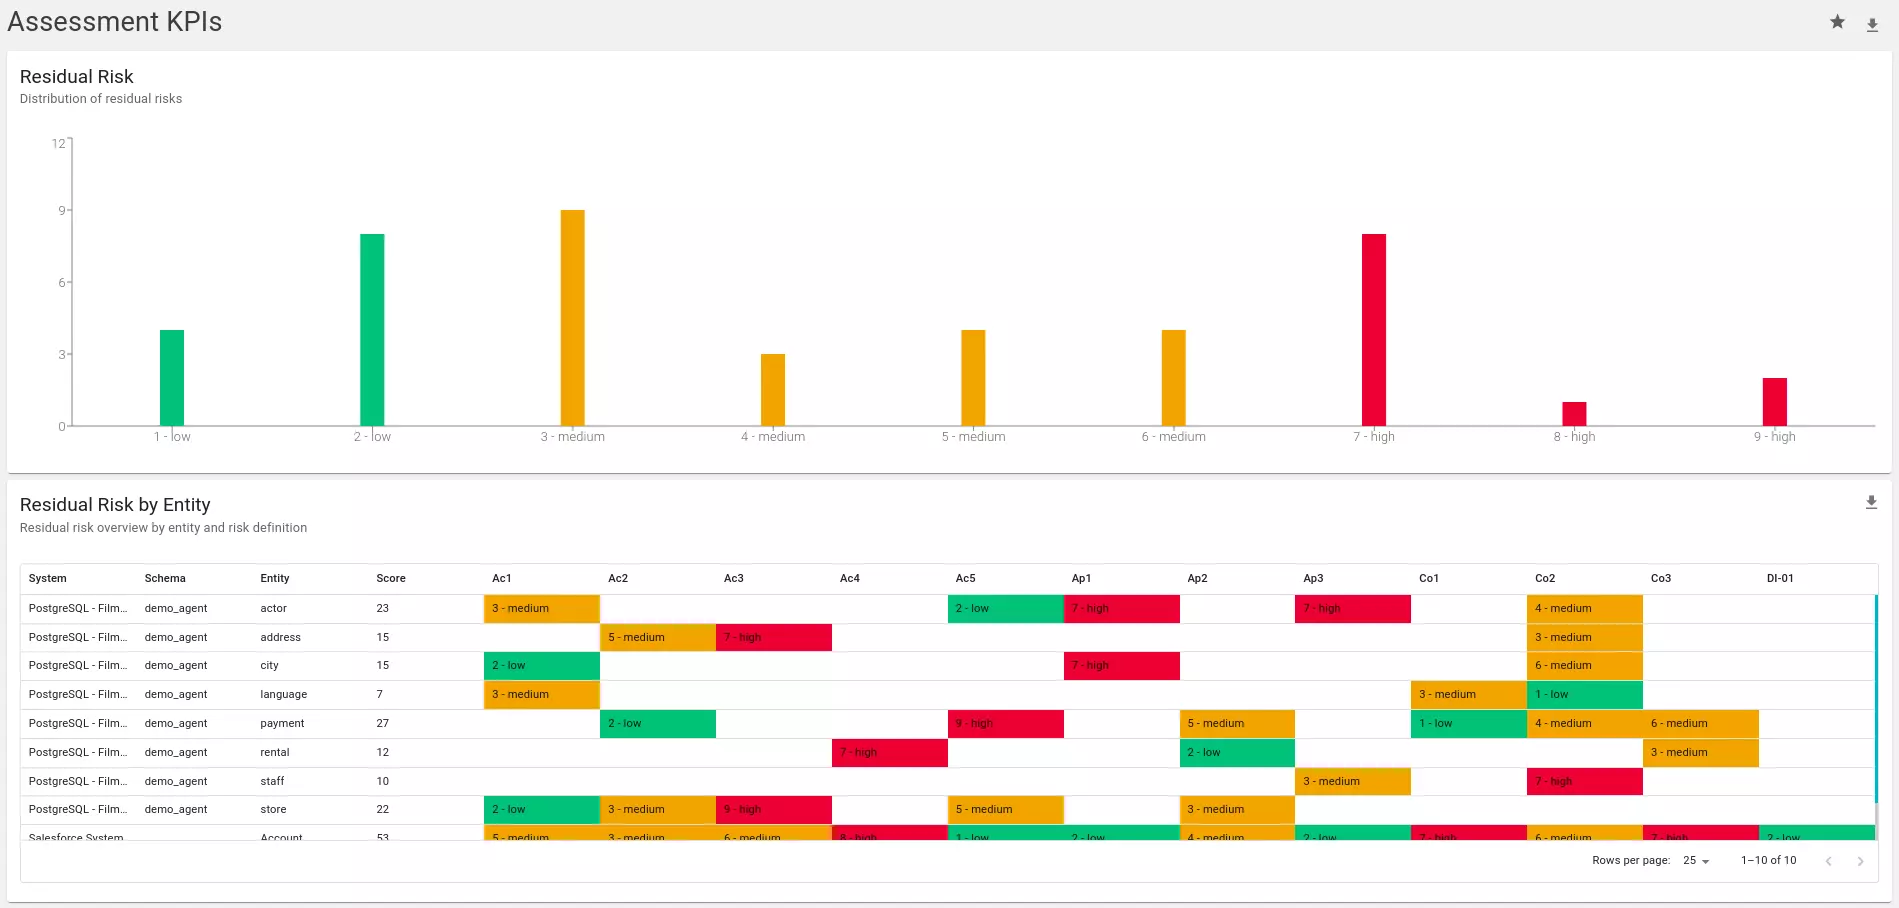
The first report shows the distribution of residual risks over the domain values. The metric is the count of risk assessments performed on physical entities.
The second report, on the other hand, shows for each physical entity recorded on the platform the residual risk assessments on all possible risks tracked. The report also shows, in the “Score” column, the value of the sum of the residual risks of each physical entity: this data is useful for highlighting the resources with the highest cumulative risk (it should be noted that the report can be sorted by column; therefore it can be be meaningful to sort by the “Score” column).
In this section it is also possible to download in CSV form all the risk and effectiveness assessments of the controls entered in the platform, as well as the summary report on residual risks.