Marketplace Dashboard
The Marketplace Dashboard helps you understand how the marketplace is used across the organization: who consumes data products, how consumers are distributed by type, and how access requests evolve over time.
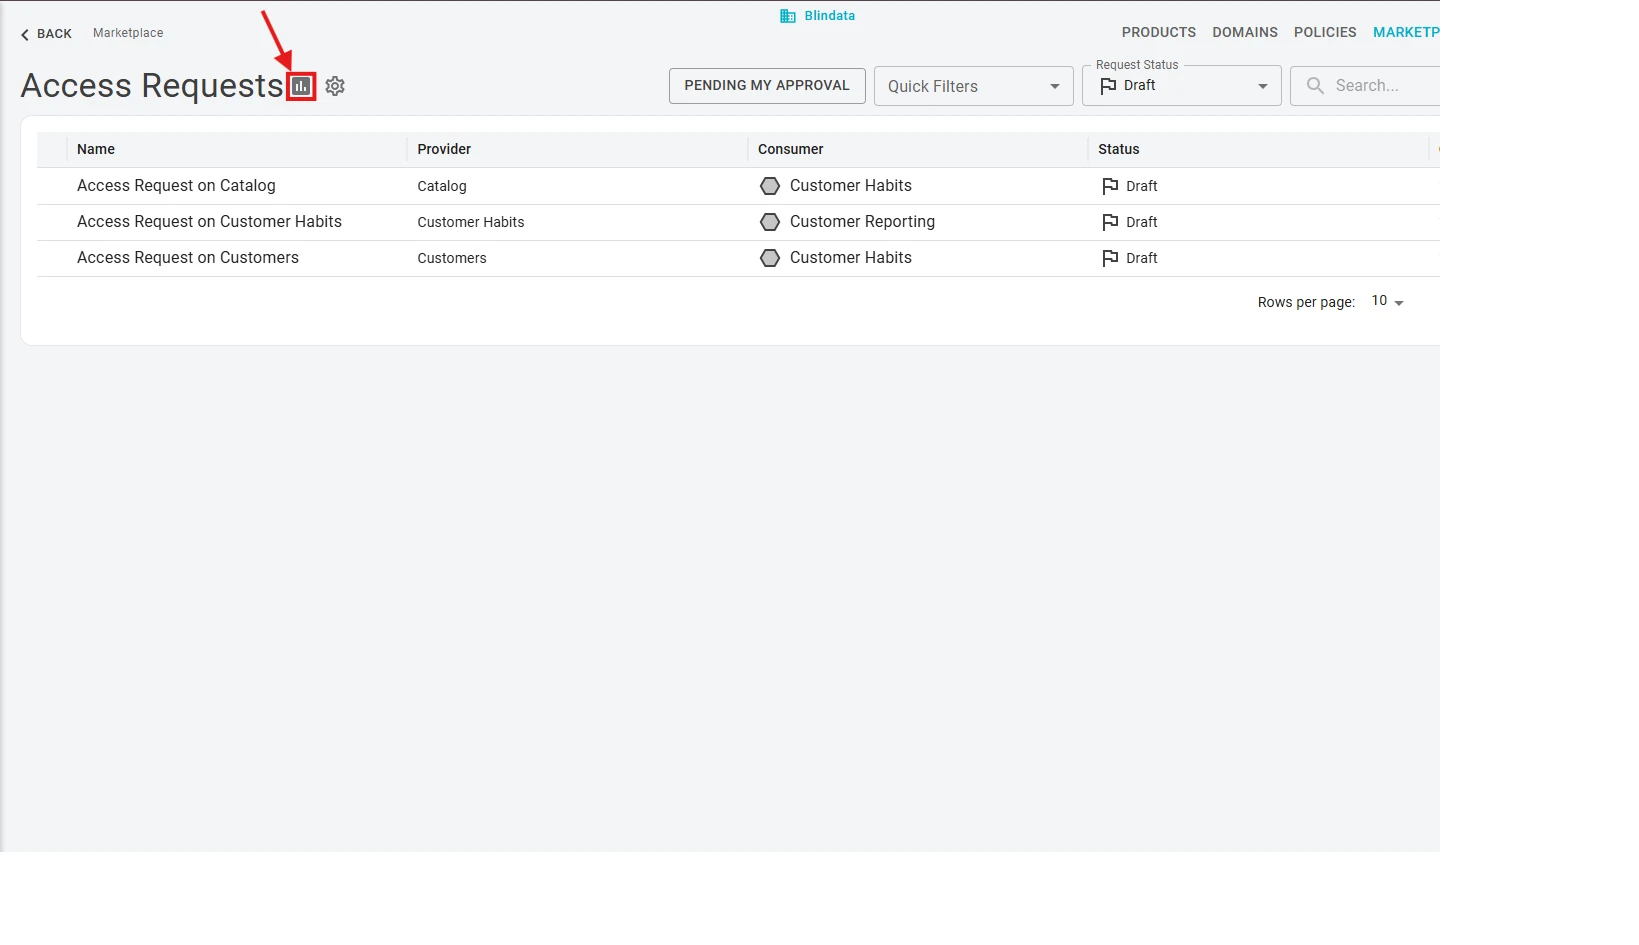
Opening the dashboard
To open the dashboard, use the control shown below.
The dashboard page is organized into two tabs:
- Consumers — aggregate metrics and breakdowns of consumers by type, domain, and provider.
- Timeline — request volumes and daily activity over a selected period.
Consumers tab
The Consumers tab summarizes marketplace adoption at a glance.
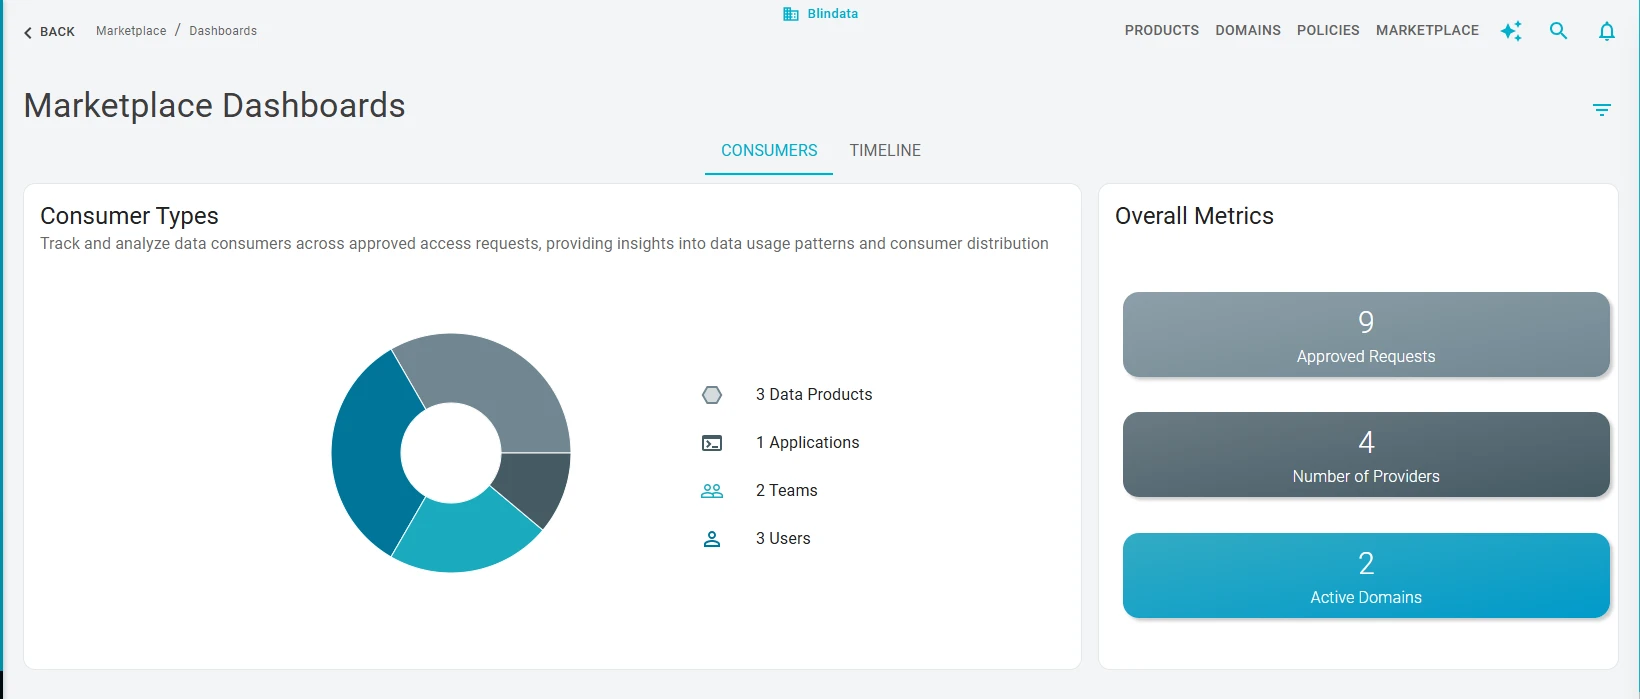
You get:
- A pie chart of consumers split by type: Data Products, Applications, Teams, and Users.
- Approved requests — the count of approved access requests.
- Providers — the number of distinct active providers: data products that have at least one consumer.
- Active domains — the number of domains that contain at least one active provider.
Use the domain filters to restrict the view to a single domain and see these overall figures only for that domain.
Consumers by provider and domain
Below the summary, a table lists active providers and, for each row, how many consumers fall into each consumer type.
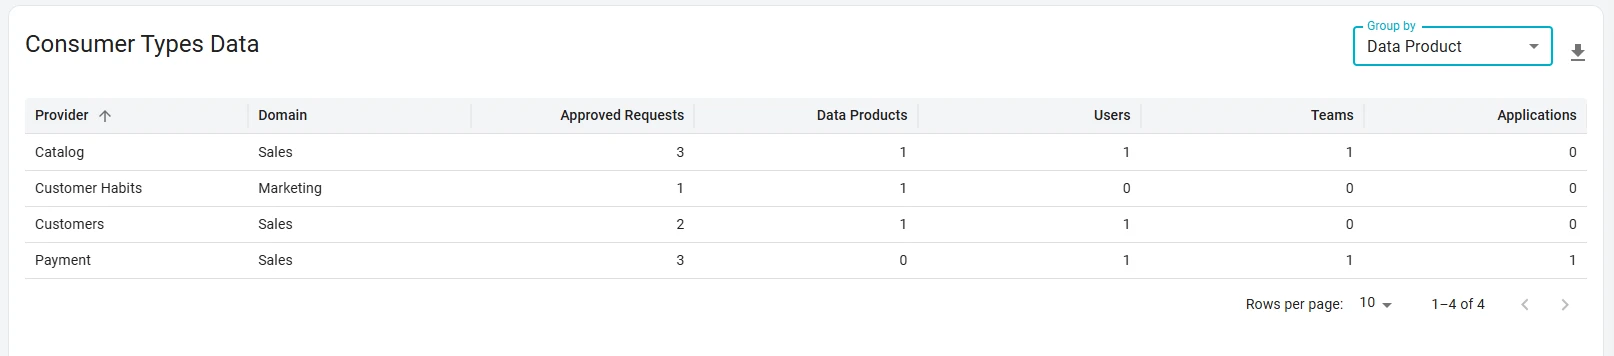
You can group the table by domain so that you see active domains and the count of each consumer type within them, instead of the default per-provider breakdown group by data product.
Timeline tab
The Timeline tab focuses on when requests are submitted and how they progress through approval and grant.
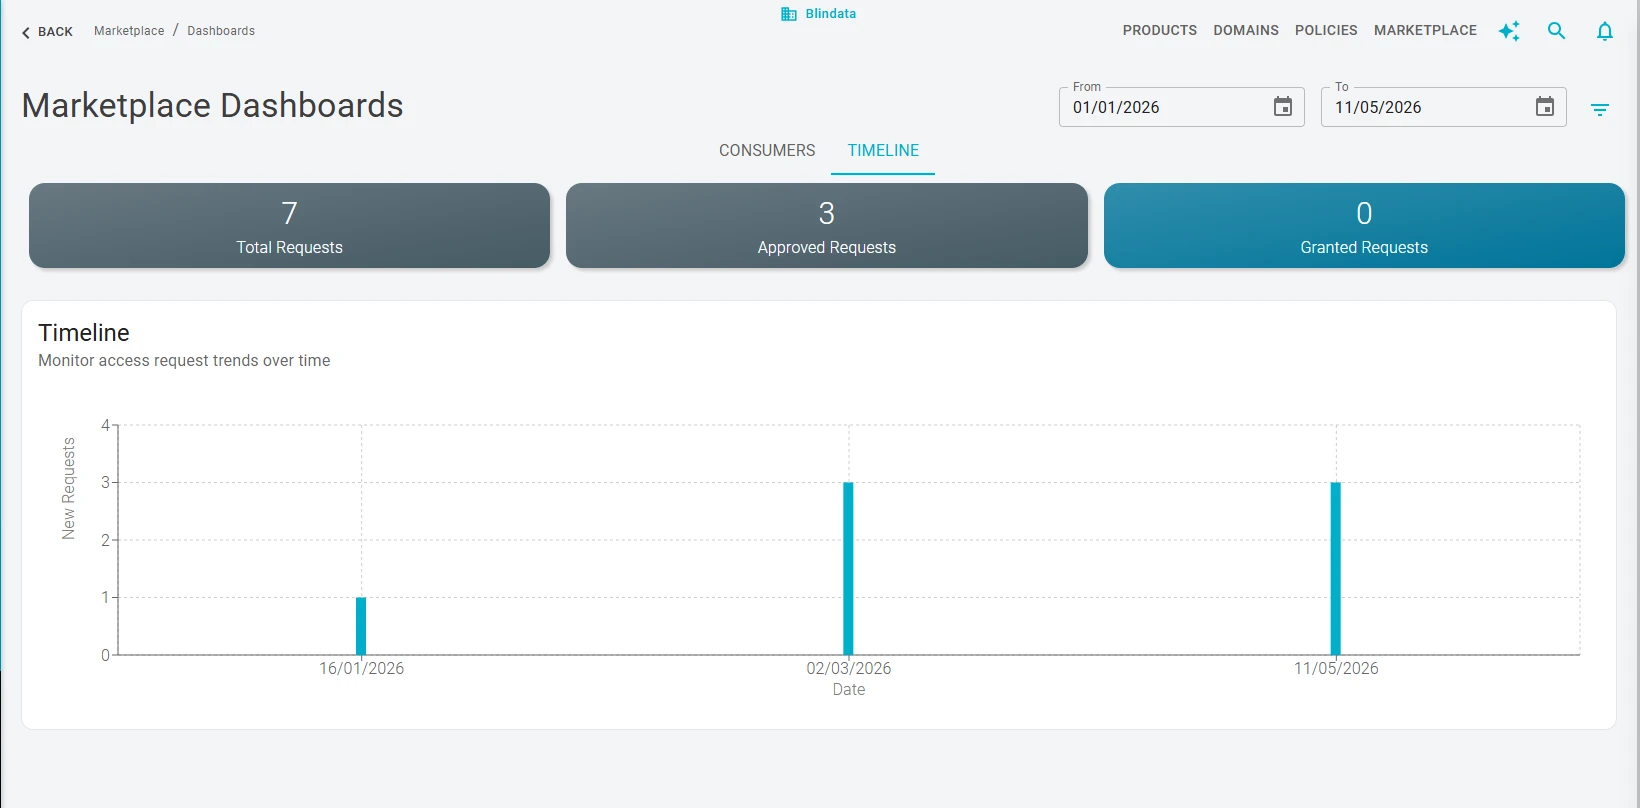
Set the From and To filters to define the analysis window. After you choose the period, the dashboard shows:
- Total requests — how many new access requests were submitted for approval in that period.
- Approved requests — how many requests submitted in the period have been approved.
- Granted requests — how many requests submitted in the period have been granted.
A bar chart displays new requests (submissions) per day, so you can see how total request volume is distributed day by day across the selected range.