Lineage Visualization Options
Data lineage chart
Blindata provides powerful tools for visualizing data lineage, allowing users to gain insights into the flow of data within a physical entity or a physical field through an intuitive flow chart interface. The data lineage visualization for a physical resource is depicted by its incoming and outgoing data flows.
Visualize the lineage chart
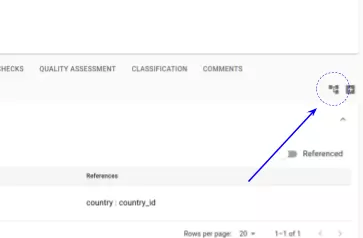
To access this visualization, simply click on the “DataFlows” tab, prominently located on the detail page of a data catalog item, as illustrated in the image below:
The figure below exemplifies a data lineage flow chart:
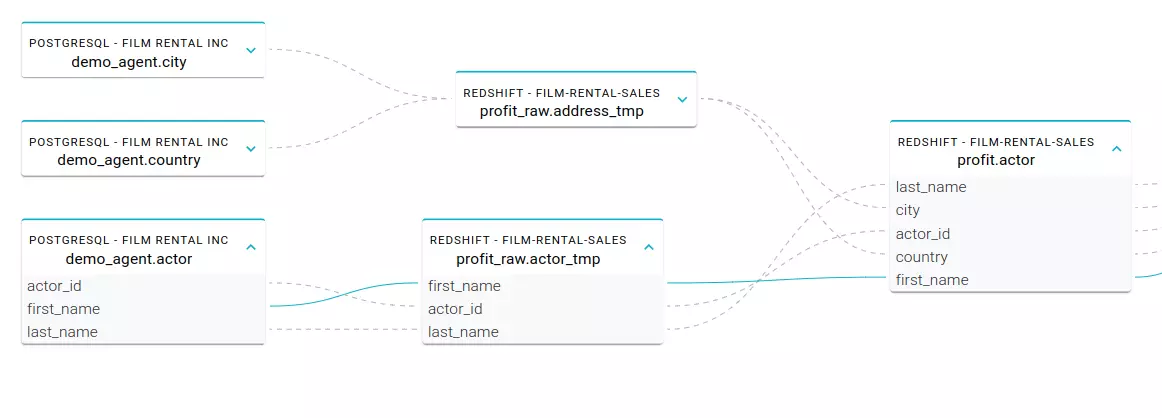
In this visual representation:
- Each node corresponds to a physical entity.
- The node’s fields represent the physical fields.
- Edges symbolize the data flows between entities.
On the graph, users can perform the following actions:
- Expand or collapse nodes for a clearer view.
- Zoom in or out to adjust the viewing window size.
- Move the entire graph or individual nodes for better exploration.
Navigating the chart
To navigate through the data lineage graph:
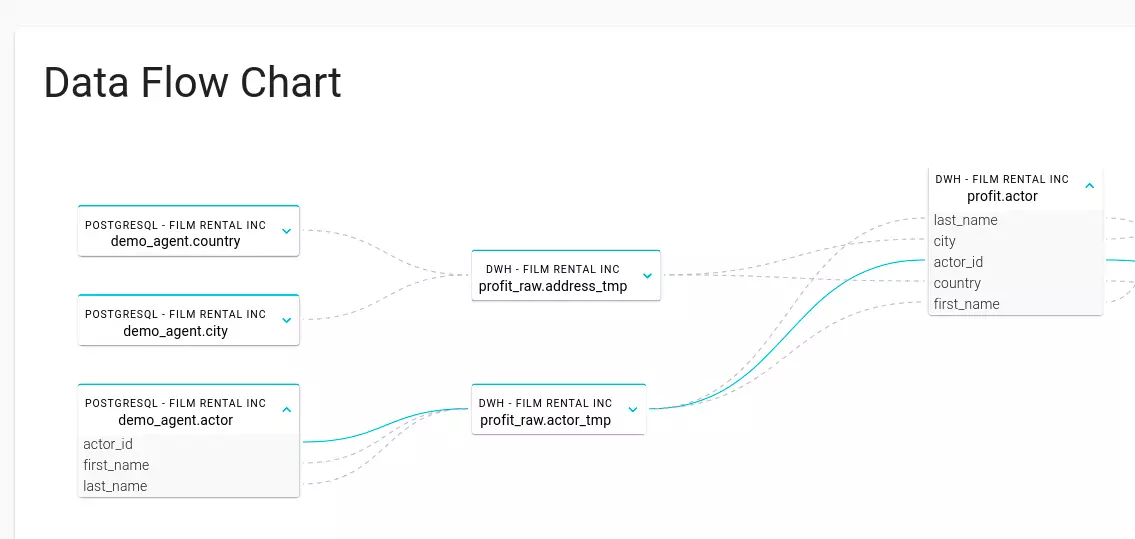
- Left-click on a field within a node to trace and display the entire data path within the graph. See the example below, where the “first_name” field has been selected.
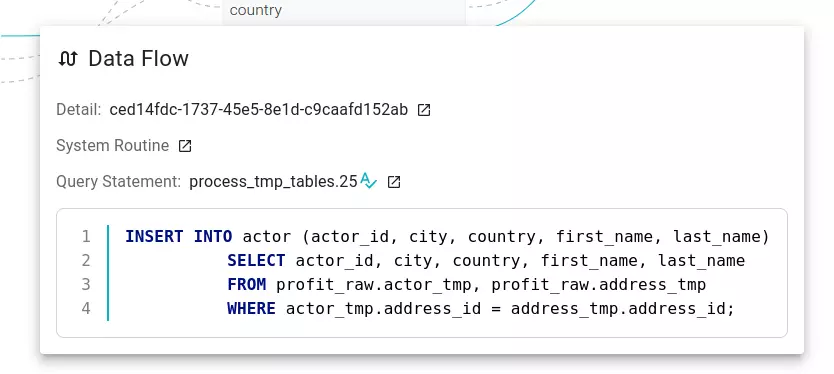
- Right-click on a node or edge to access detailed information. The figure below illustrates the details of a data flow generated by an SQL statement.
Generating a Filtered Lineage Chart
To obtain a customized lineage chart, navigate to the dataflow registry and click on the chart icon. This feature enables you to filter and visualize the specific data flows you are interested in.
Additionally, within system routines, you have the option to generate a comprehensive dataflow chart. This chart encompasses all the data assets involved in the routine SQL script, providing a holistic view of the data interactions within the system routine.
Explore and analyze your data lineage effectively with Blindata’s versatile visualization options.