Track Business Glossary Maturity
Introduction
Blindata provides metrics and dashboards across the platform so you can monitor how metadata programs are adopted, where gaps remain, and whether governance goals are being met. These views are designed for day-to-day stewardship work, but they also serve a broader purpose: they give you repeatable indicators you can track over time, share with leadership, and embed in a glossary success plan.
For the Business Glossary, three dashboards answer complementary questions about maturity:
| Dashboard | Core question |
|---|---|
| Semantic Linking | Are business concepts and attributes connected to physical data in the catalog? |
| Responsibilities | Are the right people assigned, and is workload balanced across stewards? |
| Metadata Fill Rate | Is the information defined on concepts and attributes actually filled in? |
Together, they let you move from anecdotal progress (“we started a glossary project”) to measurable outcomes. For example, you can raise concept-to-entity linking coverage in a domain, close responsibility gaps before a namespace handover, or reach a target fill rate on custom classification properties across all namespaces.
What to measure and why
A Business Glossary only delivers value when it is defined, connected to data, and owned. The three dashboards map directly to those pillars. Understanding why each dimension matters helps you choose the right view, set realistic targets, and design cleanup or onboarding campaigns.
Semantic linking to physical assets
The glossary describes what data means in business terms. That meaning reaches consumers, quality rules, and data products only when concepts and attributes are linked to physical entities and fields in the Data Catalog . Without those links, the glossary remains a standalone vocabulary: useful as documentation, but disconnected from operational metadata.
Monitoring semantic linking helps you:
- Measure adoption of catalog integration: track how many concepts have at least one linked entity and how many attributes have a linked field.
- Prioritize linking work: compare namespaces or drill down to individual concepts and attributes that still lack connections.
- Support downstream governance: linked glossary elements ground policies , quality checks, and semantic search in real assets. See Linking Catalog Assets To Business Glossary for how links are created manually, in bulk, or through Data Classification .
Treat linking coverage as a leading indicator: as it rises, users can discover data through business language, and automated processes can rely on consistent semantic references.
Stewardship and responsibilities
Every namespace, concept, and attribute should have clear ownership. In Blindata, ownership is expressed through Stewardship & Responsibilities : assigned roles that define who maintains, approves, or contributes to glossary resources. When Stewardship ACL is enabled for the Business Glossary, those assignments also control who can edit resources.
Monitoring responsibilities helps you:
- Verify coverage: identify namespaces or concepts with no assigned steward, or resources that lack the roles your governance model expects.
- Balance workload: see how responsibilities are distributed across users and teams, spot overloaded stewards, and redistribute work before burnout or bottlenecks slow the program.
- Close role gaps: compare assigned responsibilities against requested coverage to find resources that need additional roles filled, especially before a domain cleanup, reorganization, or onboarding of new stewards.
Responsibility metrics are essential for sustainable glossary programs: a well-modeled ontology without owners will drift; dashboards make that risk visible early.
Metadata fill rate
Defining fields on glossary objects is only the first step: teams must populate them. The Metadata Fill Rate dashboard tracks whether standard metadata, custom properties , and documentation are actually filled in on concepts and attributes.
This dimension is especially important when:
- Custom properties extend the glossary with organization-specific tags, classifications, or business attributes. If these fields are empty, governance rules that depend on them cannot be enforced consistently.
- Classification tags or domain-specific labels are expected to be applied across namespaces. For example, a Data class, Sensitivity, or Business domain tag may be defined once but edited on every concept in a portfolio review.
- Standard metadata such as descriptions, clearance levels, or computational rules must be complete before a namespace is considered production-ready.
Fill-rate monitoring turns qualitative expectations (“every concept needs a description”) into auditable percentages you can scope by namespace, filter field by field, and export for remediation sprints.
Opening the dashboards
Open the dashboards from the Business Glossary area using the dashboard icon.
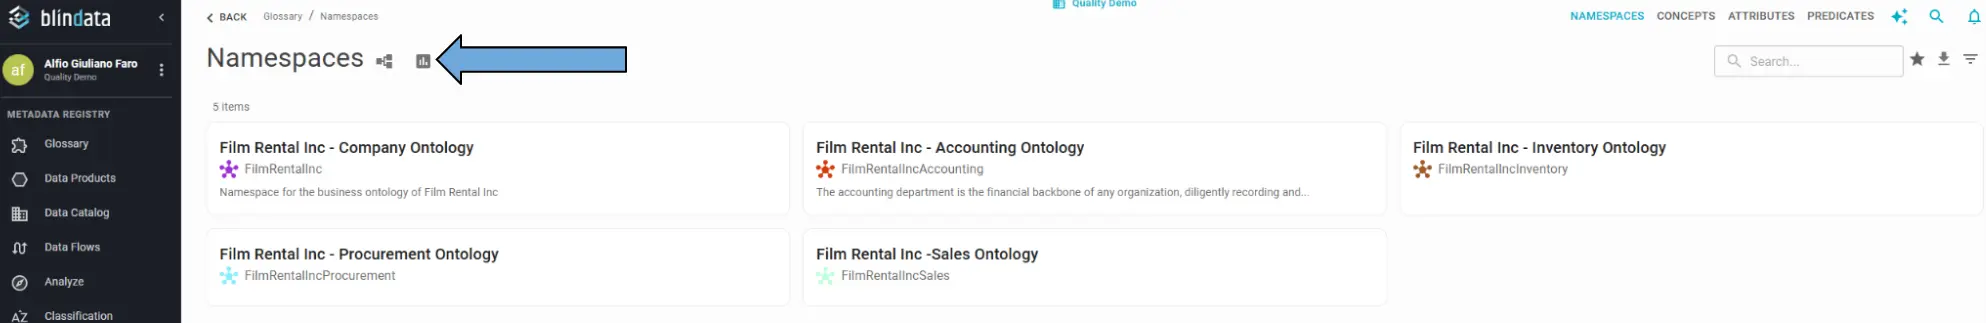
The page is split into three tabs (Semantic Linking, Responsibilities, and Metadata Fill Rate), each described in the sections below. All tables support CSV export so you can share results, track progress in external reports, or feed follow-up workflows outside Blindata.
Semantic Linking
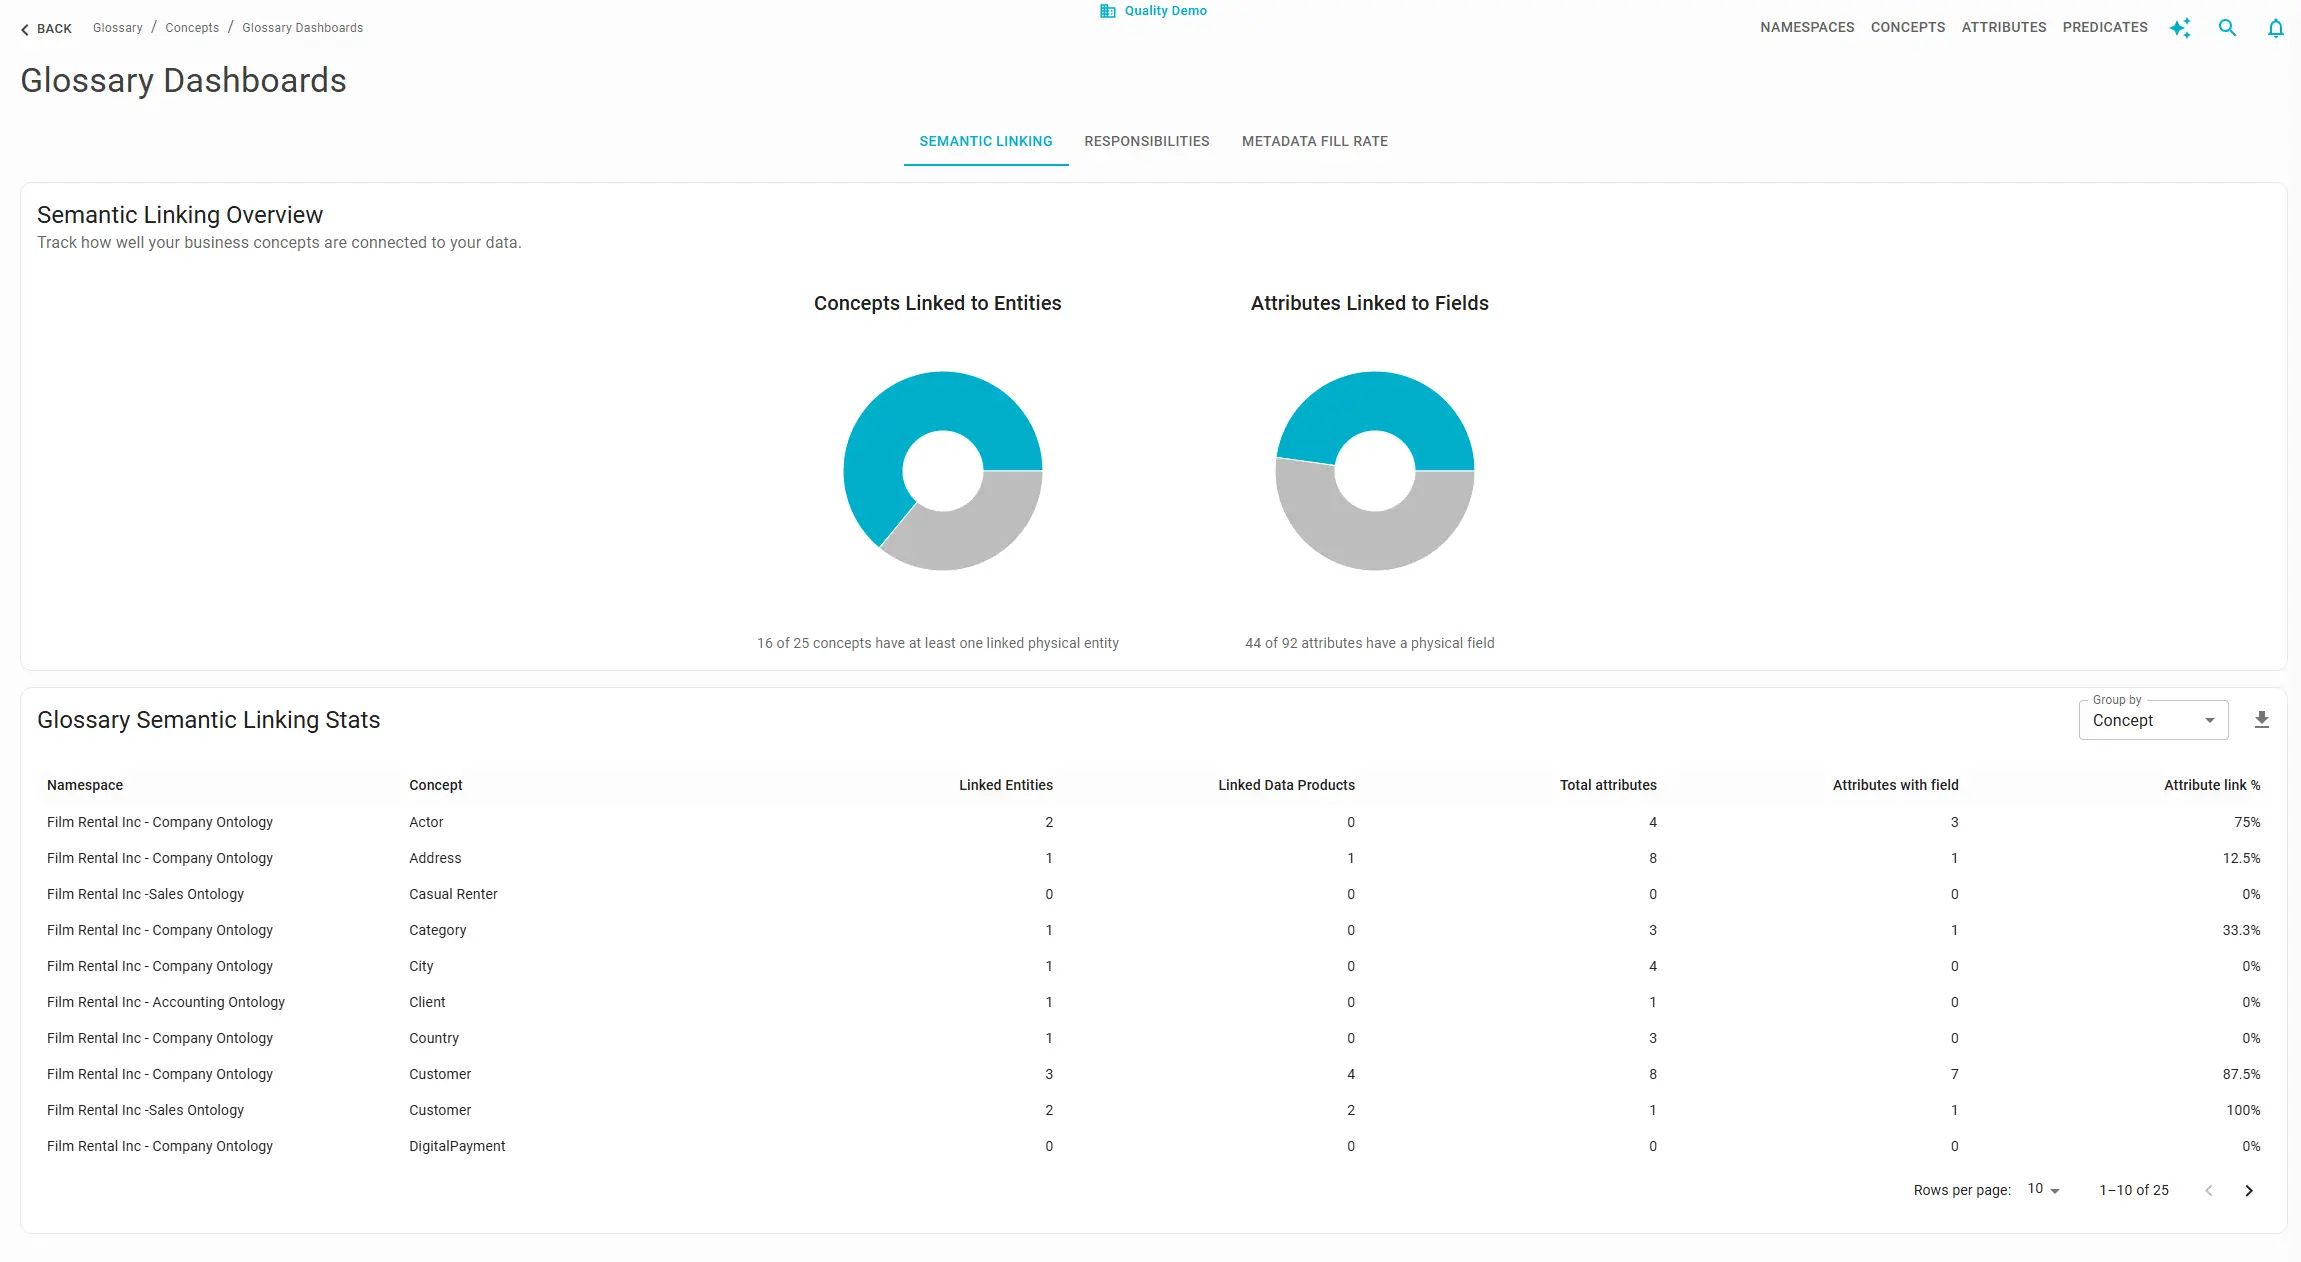
The Semantic Linking dashboard shows how closely your business concepts and attributes are connected to physical data in the catalog.
Summary charts at the top give a portfolio-level picture:
- How many concepts have at least one linked physical entity.
- How many attributes have at least one linked physical field.
Detailed table: explore the numbers at the granularity you need. Use Group by to switch the level of detail:
| Group by | Use when |
|---|---|
| Namespace | Comparing domains or reporting progress to domain leads |
| Concept | Reviewing linking status term by term |
| Attribute | Auditing field-level semantic coverage |
Download the table as CSV for reporting or to drive linking campaigns. Pair this view with manual linking , spreadsheet upload, or automated classification depending on your workflow.
Responsibilities
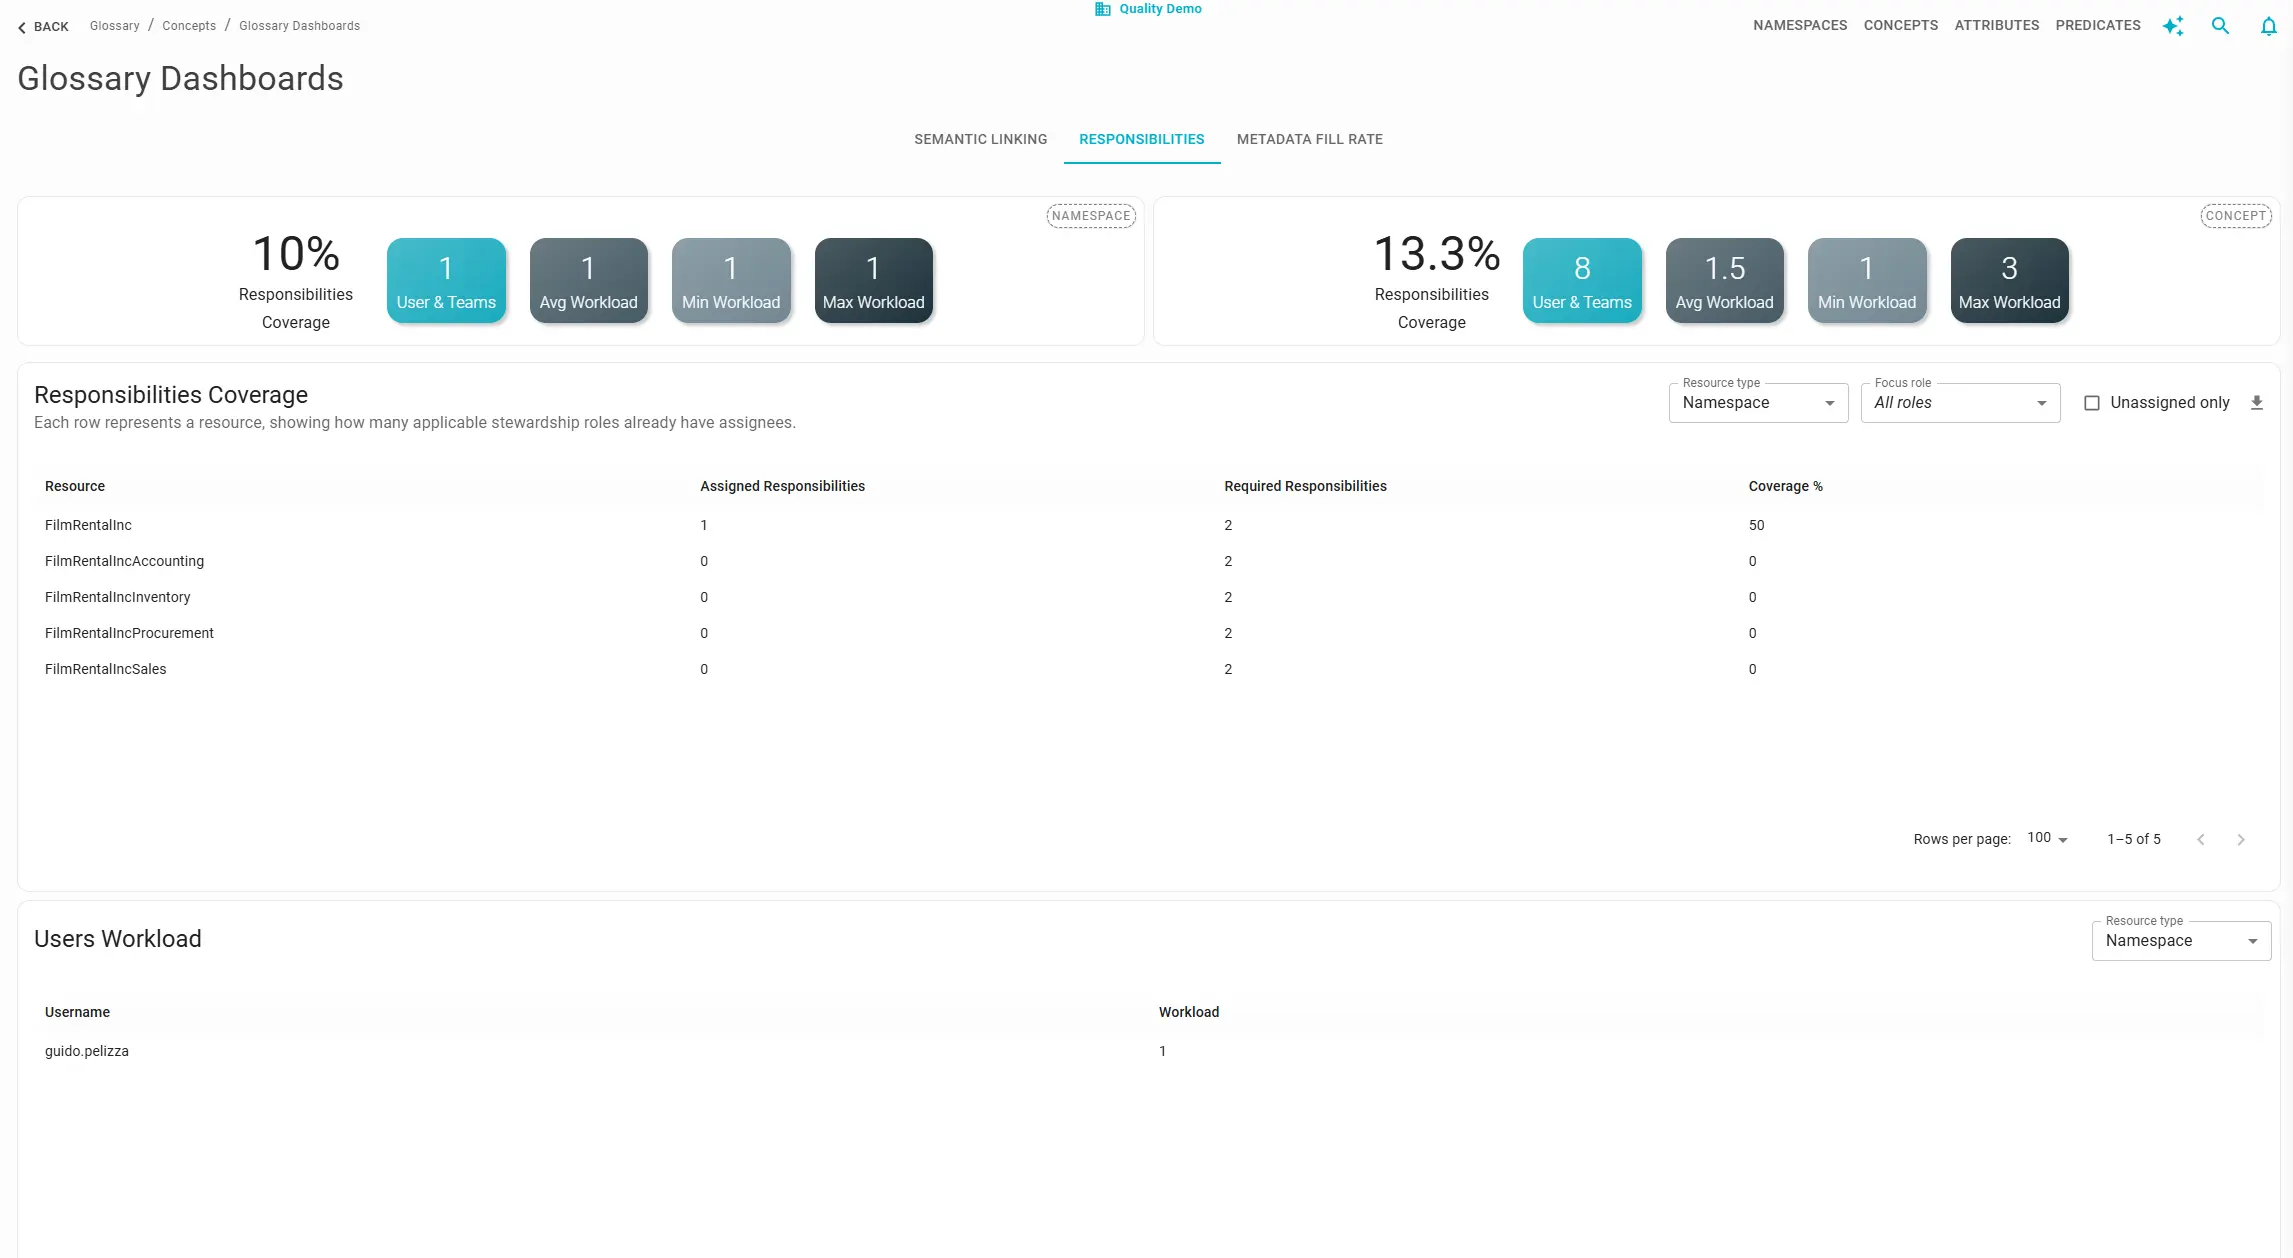
The Responsibilities dashboard shows whether glossary resources have the stewardship coverage your program requires.
Summary cards report coverage for namespaces and concepts, including:
- The share of resources with at least one assigned responsibility.
- How many users or teams are involved in glossary stewardship.
- How workload is distributed across stewards.
Two tables go deeper:
- Resource coverage: lists each namespace or concept, how many responsibilities are assigned, how many are still needed for full role coverage, and the resulting coverage percentage.
- User workload: lists each user and how many glossary responsibilities they hold.
Use the filter at the top of each table to focus on namespaces or concepts. This view is especially useful before starting a glossary cleanup, onboarding new stewards, or validating that a reorganized team has picked up ownership of its domains.
For broader stewardship metrics across resource types, see also How to Monitor Stewardship Responsibilities .
Metadata Fill Rate
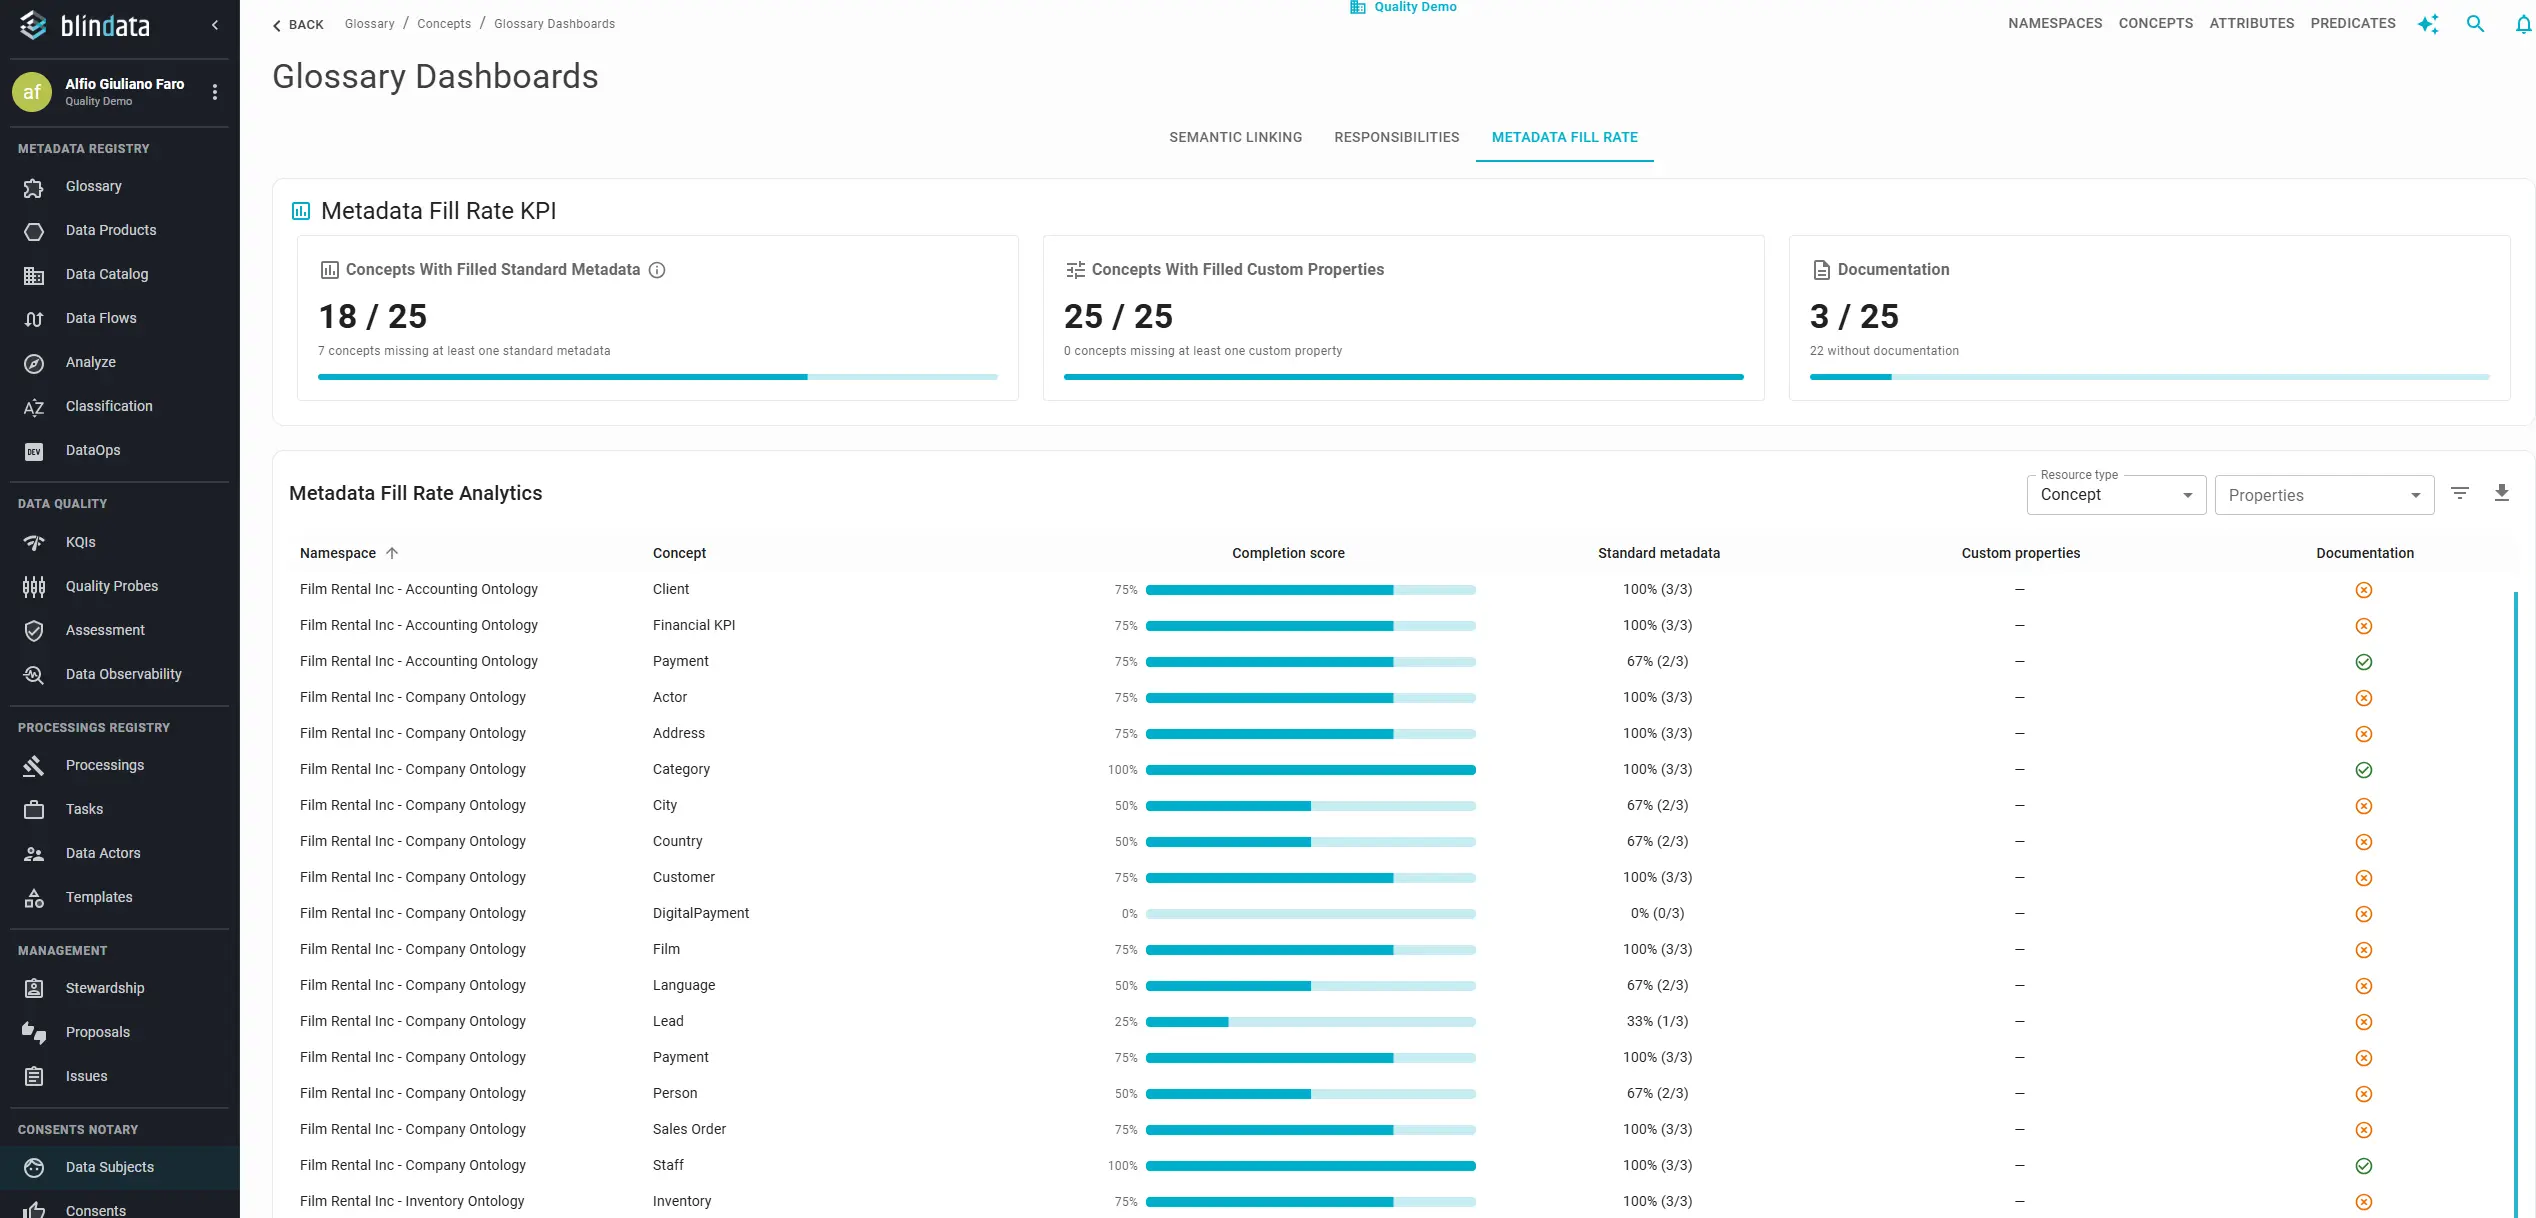
The Metadata Fill Rate dashboard answers whether the metadata defined on your glossary objects is actually populated.
Summary indicators at the top summarize the portfolio:
- Concepts with standard metadata complete.
- Concepts with all custom properties filled.
- Concepts that are documented.
Dynamic table: the layout adapts to toolbar choices so you stay on one screen while changing perspective. Start with Resource type:
| Resource type | Rows represent |
|---|---|
| Concept | One row per business concept |
| Attributes | One row per glossary attribute |
By default, each row includes Namespace, Concept (and Attribute when viewing attributes), Completion score, Standard metadata, Custom properties, and Documentation. Standard metadata and Custom properties roll up several fields into a single percentage so you can scan the table quickly; use the customization options below when you need field-level detail.
Customize columns and filters
The Metadata Fill Rate table is most powerful when you shape it around the question you are trying to answer. For example, you might ask which concepts in the Finance namespace are missing a custom Regulatory class property, rather than only looking at aggregate percentages.
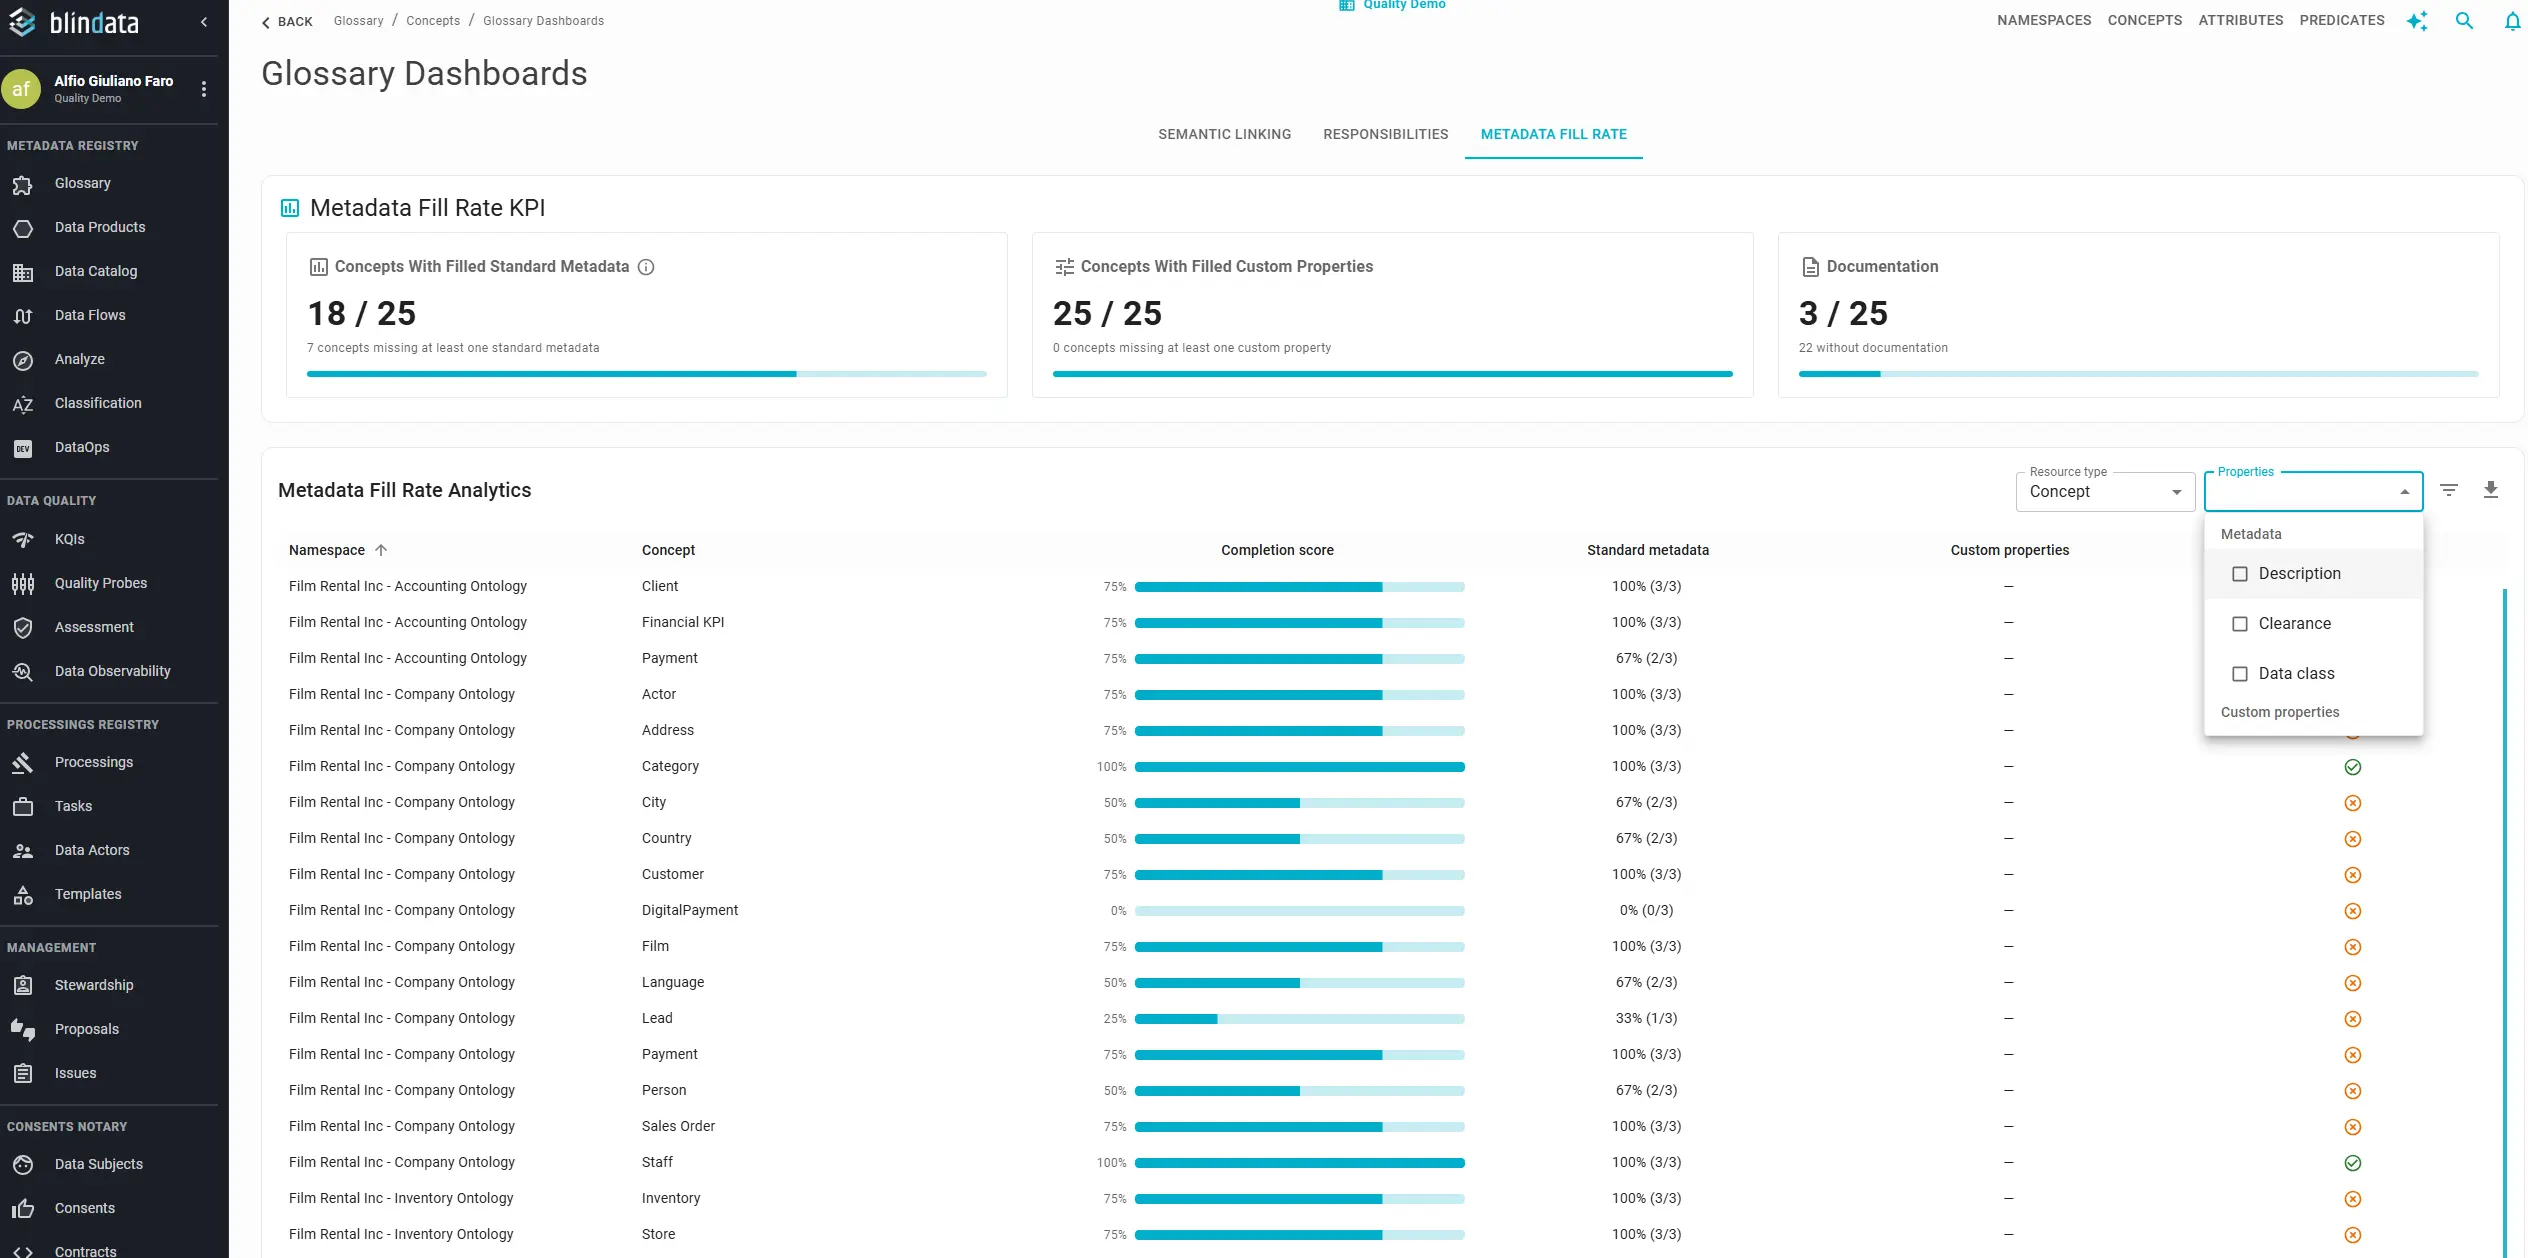
Open Properties in the toolbar. The menu is split into two groups:
- Metadata: standard fields for the selected resource type. On concepts, this includes fields such as Description, Clearance, and Data class. On attributes, it includes fields such as Description, Computational rules, Constraint description, and Patterns.
- Custom properties: every additional property configured on glossary objects in your tenant. Organization-specific tags, classifications, and business attributes appear here.
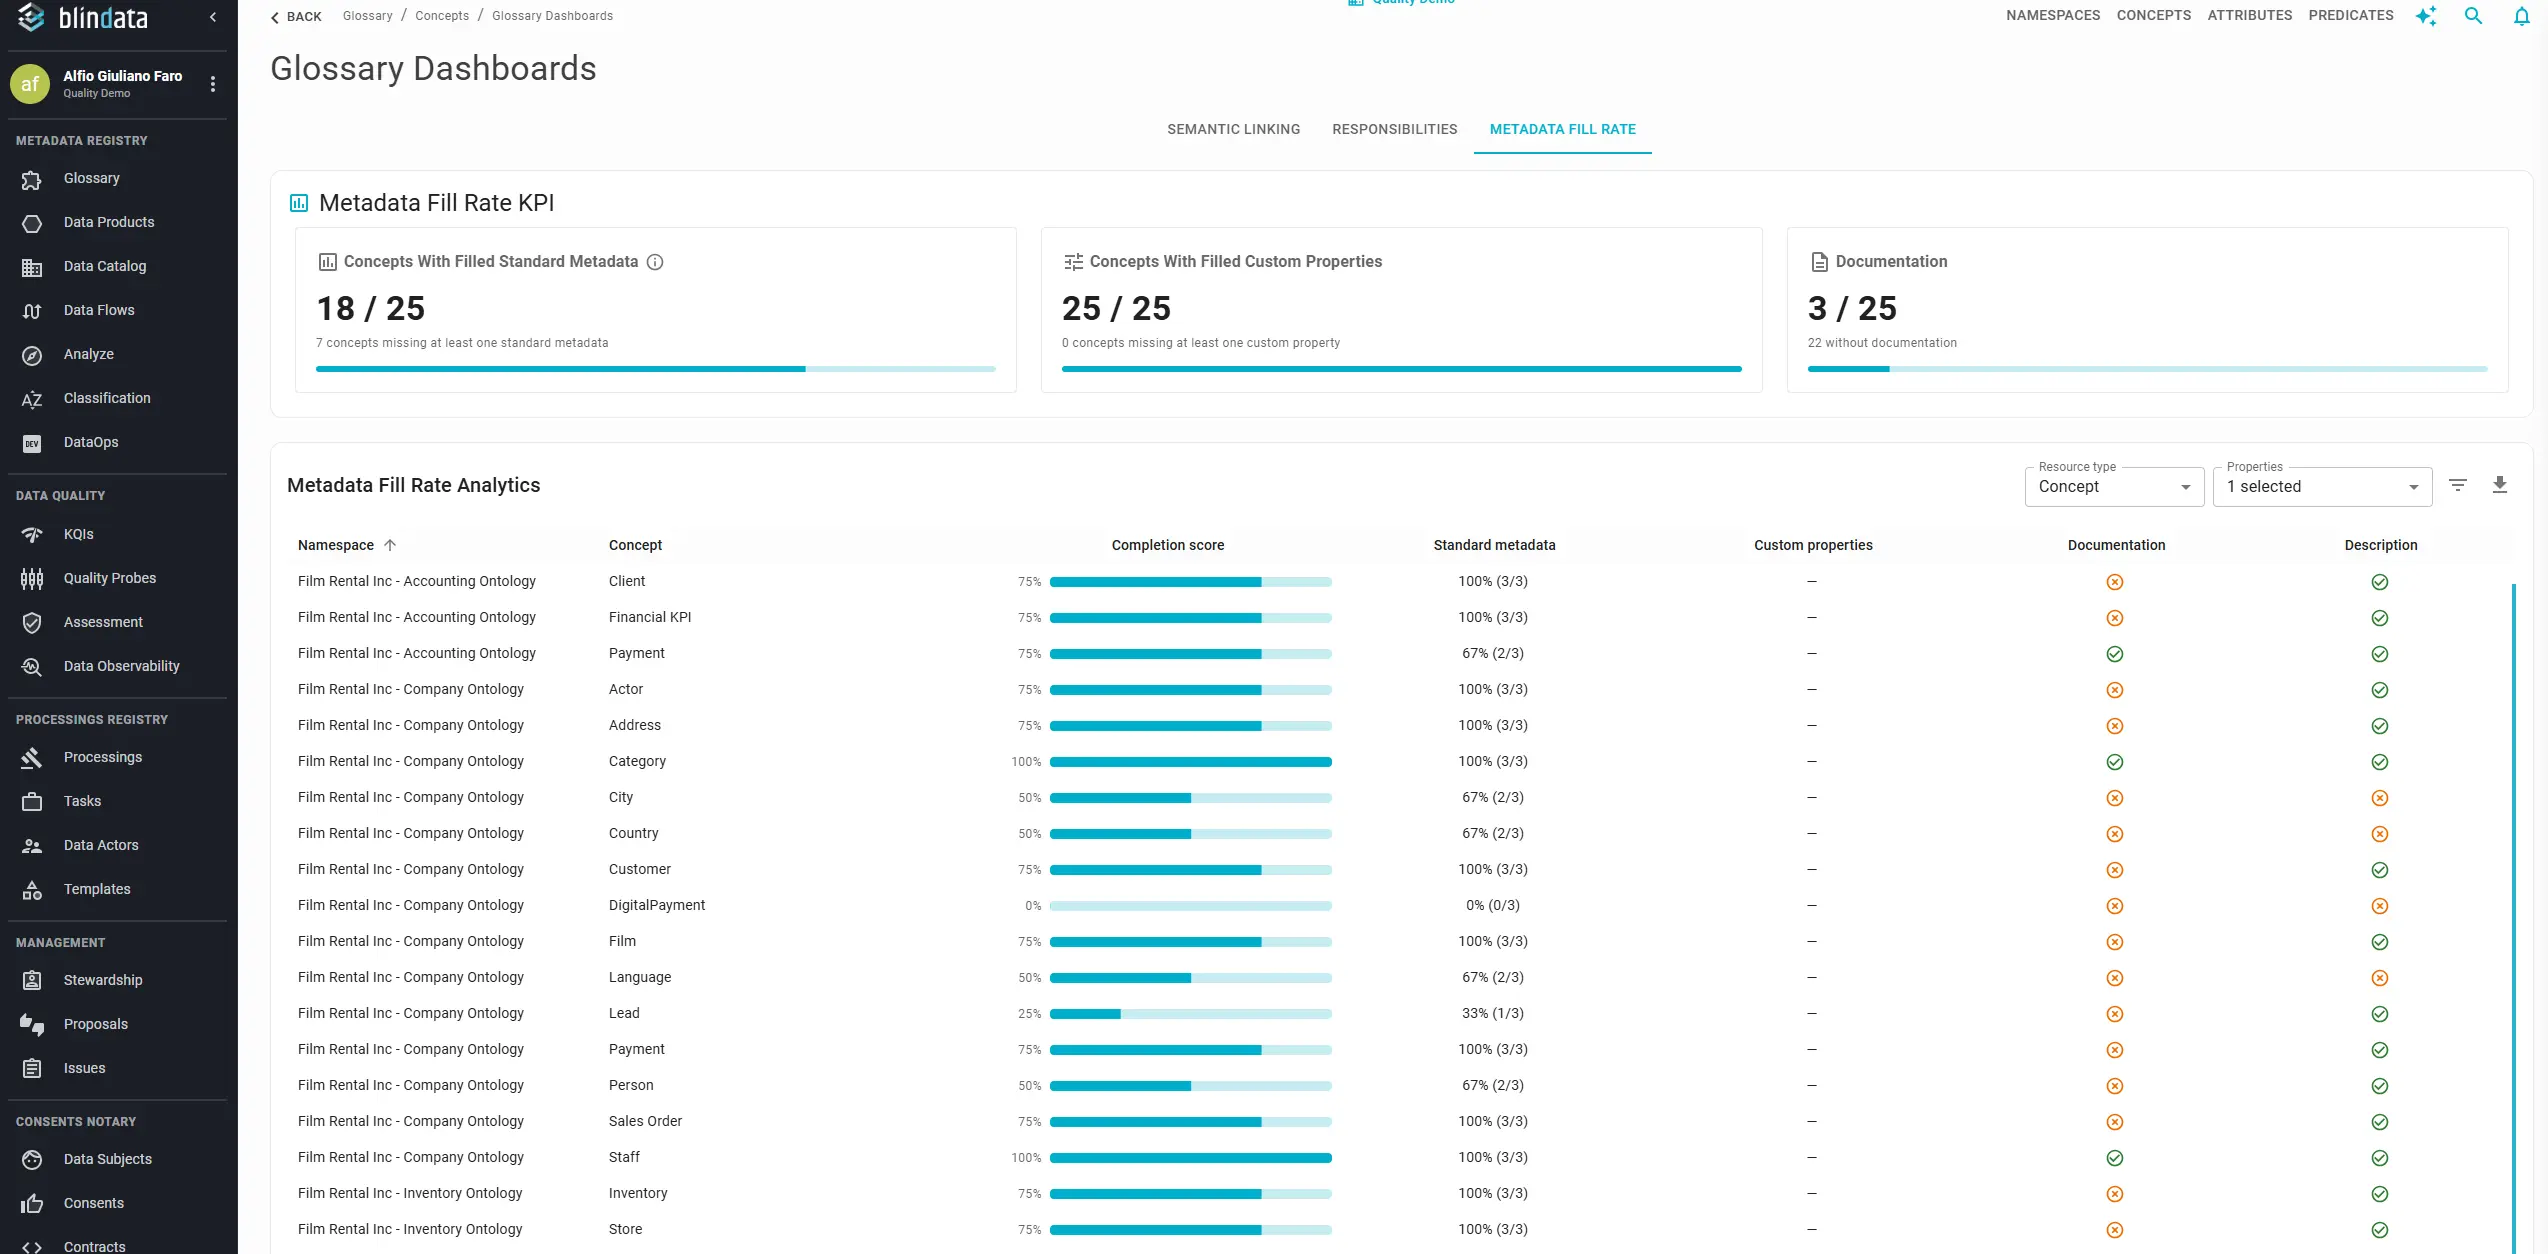
Each selected property adds a dedicated column showing, row by row, whether the value is filled or empty. Remove the selection and the column disappears. There is no limit on how many properties you can expose at once: select one field for a focused audit, or several (even all of them) to build a governance checklist view.
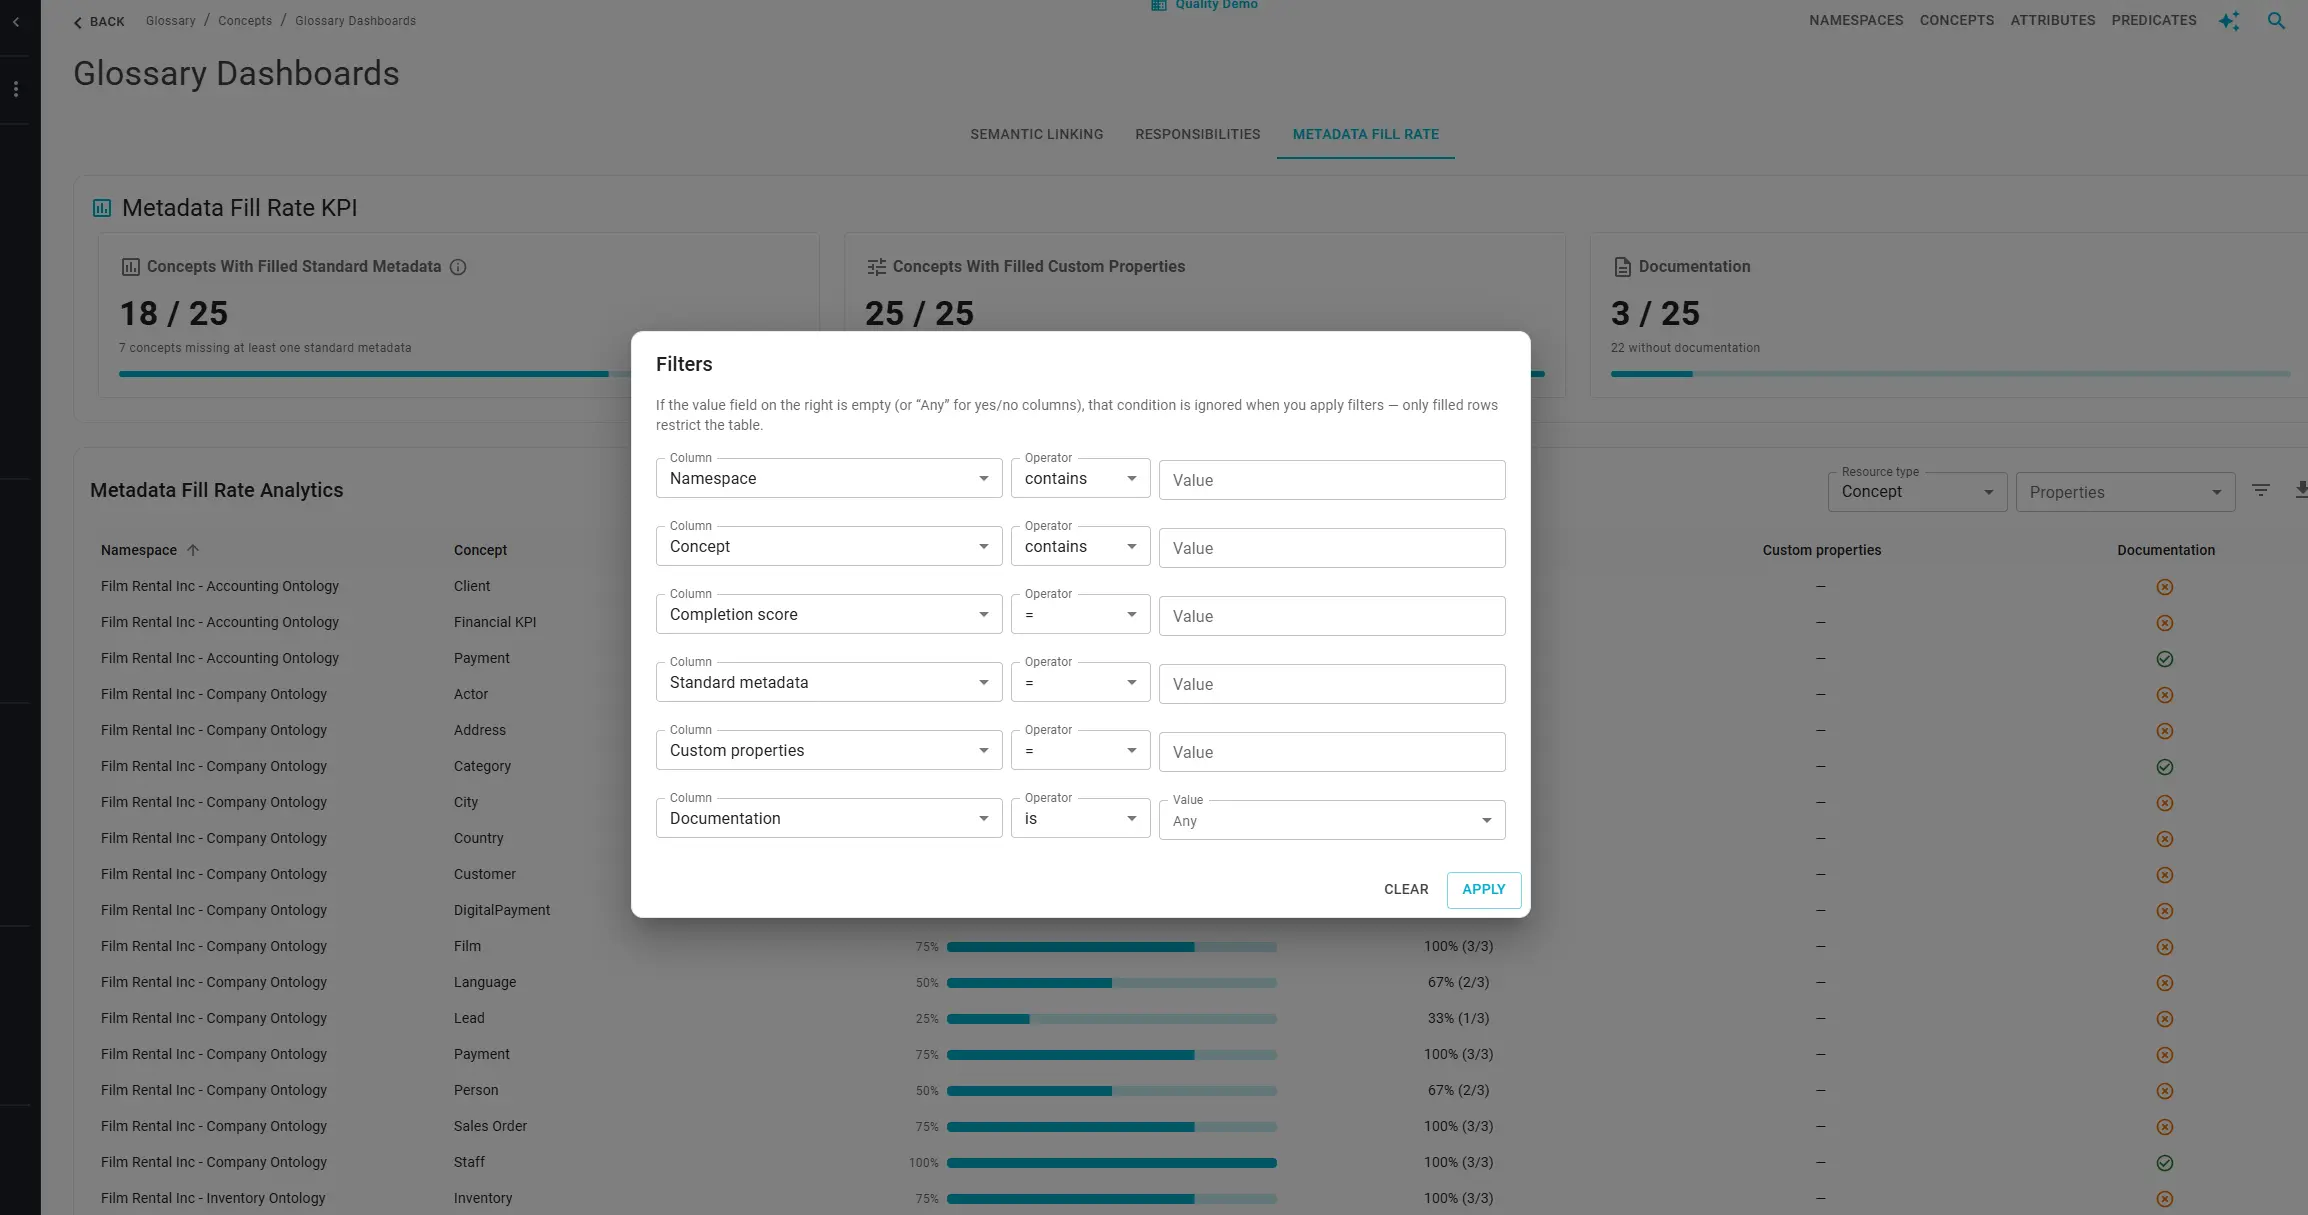
Click the Filters icon to open the filter panel. The panel lists every column currently visible, including property columns added through Properties. Pick a column, choose a condition, and apply. Only matching rows remain. Combine conditions (for example, a given namespace and an empty Description and an empty custom classification tag) to narrow down exactly the resources to fix.
Typical workflows:
- A steward preparing a cleanup adds Description, filters for empty values, and exports the list for a sprint backlog.
- A governance lead reviewing custom tagging turns on every custom property column across namespaces and exports the result for a cross-domain compliance review.
- A domain owner scopes by namespace in the filter panel and inspects standard metadata field by field before sign-off.
CSV export always matches what you see: same resource type, same extra columns, same filters applied.
Tips across dashboards
- On Semantic Linking, Group by changes how rows are grouped without leaving the dashboard. Use it to shift from executive summaries to remediation lists.
- On Responsibilities, each table has its own filter for namespace or concept; compare resource coverage and user workload in the same session to both fill gaps and avoid over-assigning a single steward.
- On Metadata Fill Rate, use Properties and Filters together: define the columns that matter for your success metrics first, then filter and export against those exact fields.
Revisit these dashboards on a regular cadence (monthly for active programs, quarterly for stable portfolios) to turn one-off cleanups into sustained adoption tracking.