Monitor Your Data Product Portfolio
Introduction
Blindata provides metrics and dashboards across the platform so you can monitor how metadata and data product programs are adopted, where gaps remain, and whether governance goals are being met. These views support day-to-day product ownership work, but they also give you repeatable indicators you can track over time, share with leadership, and embed in a data product success plan.
For Data Products, four dashboards answer complementary questions about maturity:
| Dashboard | Core question |
|---|---|
| Semantic Linking | Is the physical data behind each product connected to the Business Glossary? |
| Downstream Dependencies | Which products and domains are most reused across the platform? |
| Responsibilities | Are the right people assigned, and is workload balanced across owners? |
| Metadata Fill Rate | Is the metadata defined on each product actually filled in? |
Together, they let you move from anecdotal progress (“we started building our product portfolio”) to measurable outcomes. For example, you can raise glossary linking coverage in a domain, identify high-impact products before a breaking change, close ownership gaps before onboarding new product teams, or reach a target fill rate on custom properties across all domains.
What to measure and why
A data product catalog delivers value when products are semantically grounded, structurally connected, owned, and documented. The four dashboards map to those pillars. Understanding why each dimension matters helps you choose the right view, set realistic targets, and plan remediation or onboarding campaigns.
Semantic linking to the Business Glossary
Data products expose physical schemas through output ports. Semantic linking measures how many of those entities and fields are connected to concepts and attributes in the Business Glossary . Without those links, the catalog describes what data exists but not what it means in shared business language.
Monitoring semantic linking helps you:
- Measure glossary adoption on products: track how many physical entities have at least one linked concept and how many fields have a linked attribute.
- Prioritize linking work: compare domains or drill down to individual products that still lack connections.
- Support downstream governance: linked assets ground policies , quality checks, and discovery in business terms. See Linking Catalog Assets To Business Glossary for how links are created.
Treat linking coverage as a leading indicator of catalog maturity: as it rises, products become discoverable and governable through the same vocabulary used across the organization.
Downstream dependencies and reuse
Across a data product portfolio, value often comes from reuse: domains publish products that other teams consume to build new capabilities. The Downstream Dependencies dashboard tracks structural consumption: which data products declare a dependency on another product’s output port through their input ports.
Blindata counts, for each producer product:
- Total downstream dependents: how many distinct data products depend on its output ports.
- Same-domain dependencies: dependents that belong to the same domain as the producer.
- External-domain dependencies: dependents that belong to a different domain, showing cross-domain reuse.
Monitoring downstream dependencies helps you:
- Identify productive domains and products: domains and products with high downstream counts are hubs in your portfolio. They deserve stable contracts, clear ownership, and careful change management.
- Measure cross-domain impact: external-domain counts reveal which products drive collaboration beyond domain boundaries and which domains act as platform providers for the rest of the organization.
- Plan changes with context: before modifying a schema, deprecating a port, or reorganizing a domain, review products that many others structurally depend on.
- Compare domains at portfolio level: roll up by domain to see which areas publish the most reused assets, not only the most products.
This dashboard reflects declared port dependencies in the catalog. It answers “who is structurally wired to consume this product?” based on input/output port relationships documented in Blindata.
Info
Structural vs actual consumption. Downstream Dependencies shows how products are declared to depend on one another. If your organization uses the Data Products Marketplace , pair this view with the Marketplace Dashboard to track actual consumption patterns: approved access requests, granted access, consumer types (data products, applications, teams, users), and activity over time. A product may show few structural dependents but high marketplace adoption, or the reverse. Using both dashboards gives a fuller picture of reuse and impact.
Stewardship and responsibilities
Every domain and data product should have clear ownership. In Blindata, ownership is expressed through Stewardship & Responsibilities : assigned roles that define who maintains, approves, or contributes to catalog resources.
Monitoring responsibilities helps you:
- Verify coverage: identify domains or products with no assigned owner, or resources that lack the roles your governance model expects.
- Balance workload: see how responsibilities are distributed across users and teams, spot overloaded product owners, and redistribute work before bottlenecks slow delivery.
- Close role gaps: compare assigned responsibilities against requested coverage to find resources that need additional roles filled, especially before launching a new product or reorganizing a domain team.
Responsibility metrics keep the catalog maintainable as the number of products grows: undocumented or unowned products quickly fall out of date.
Metadata fill rate
Publishing a data product requires more than a name and a port schema. Teams must populate standard metadata, custom properties , and documentation so consumers and governance processes can rely on the catalog.
This dimension is especially important when:
- Custom properties capture organization-specific classifications, lifecycle tags, or compliance labels expected on every product in a domain.
- Standard fields such as Description, Product status, and Product type must be complete before a product is considered discoverable or production-ready.
- Documentation sections support onboarding and contract discussions between producers and consumers.
Fill-rate monitoring turns qualitative expectations (“every product needs a description and status”) into auditable percentages you can scope by domain, filter field by field, and export for remediation sprints.
Opening the dashboards
Open the dashboards from the Data Products area using the dashboard icon.
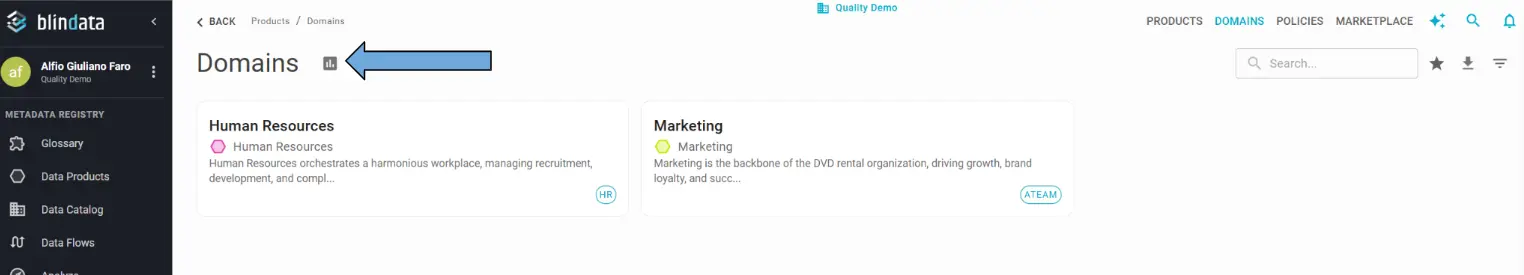
The page is split into four tabs (Semantic Linking, Downstream Dependencies, Responsibilities, and Metadata Fill Rate), each described in the sections below. All tables support CSV export so you can share results, track progress in external reports, or feed follow-up workflows outside Blindata.
Semantic Linking
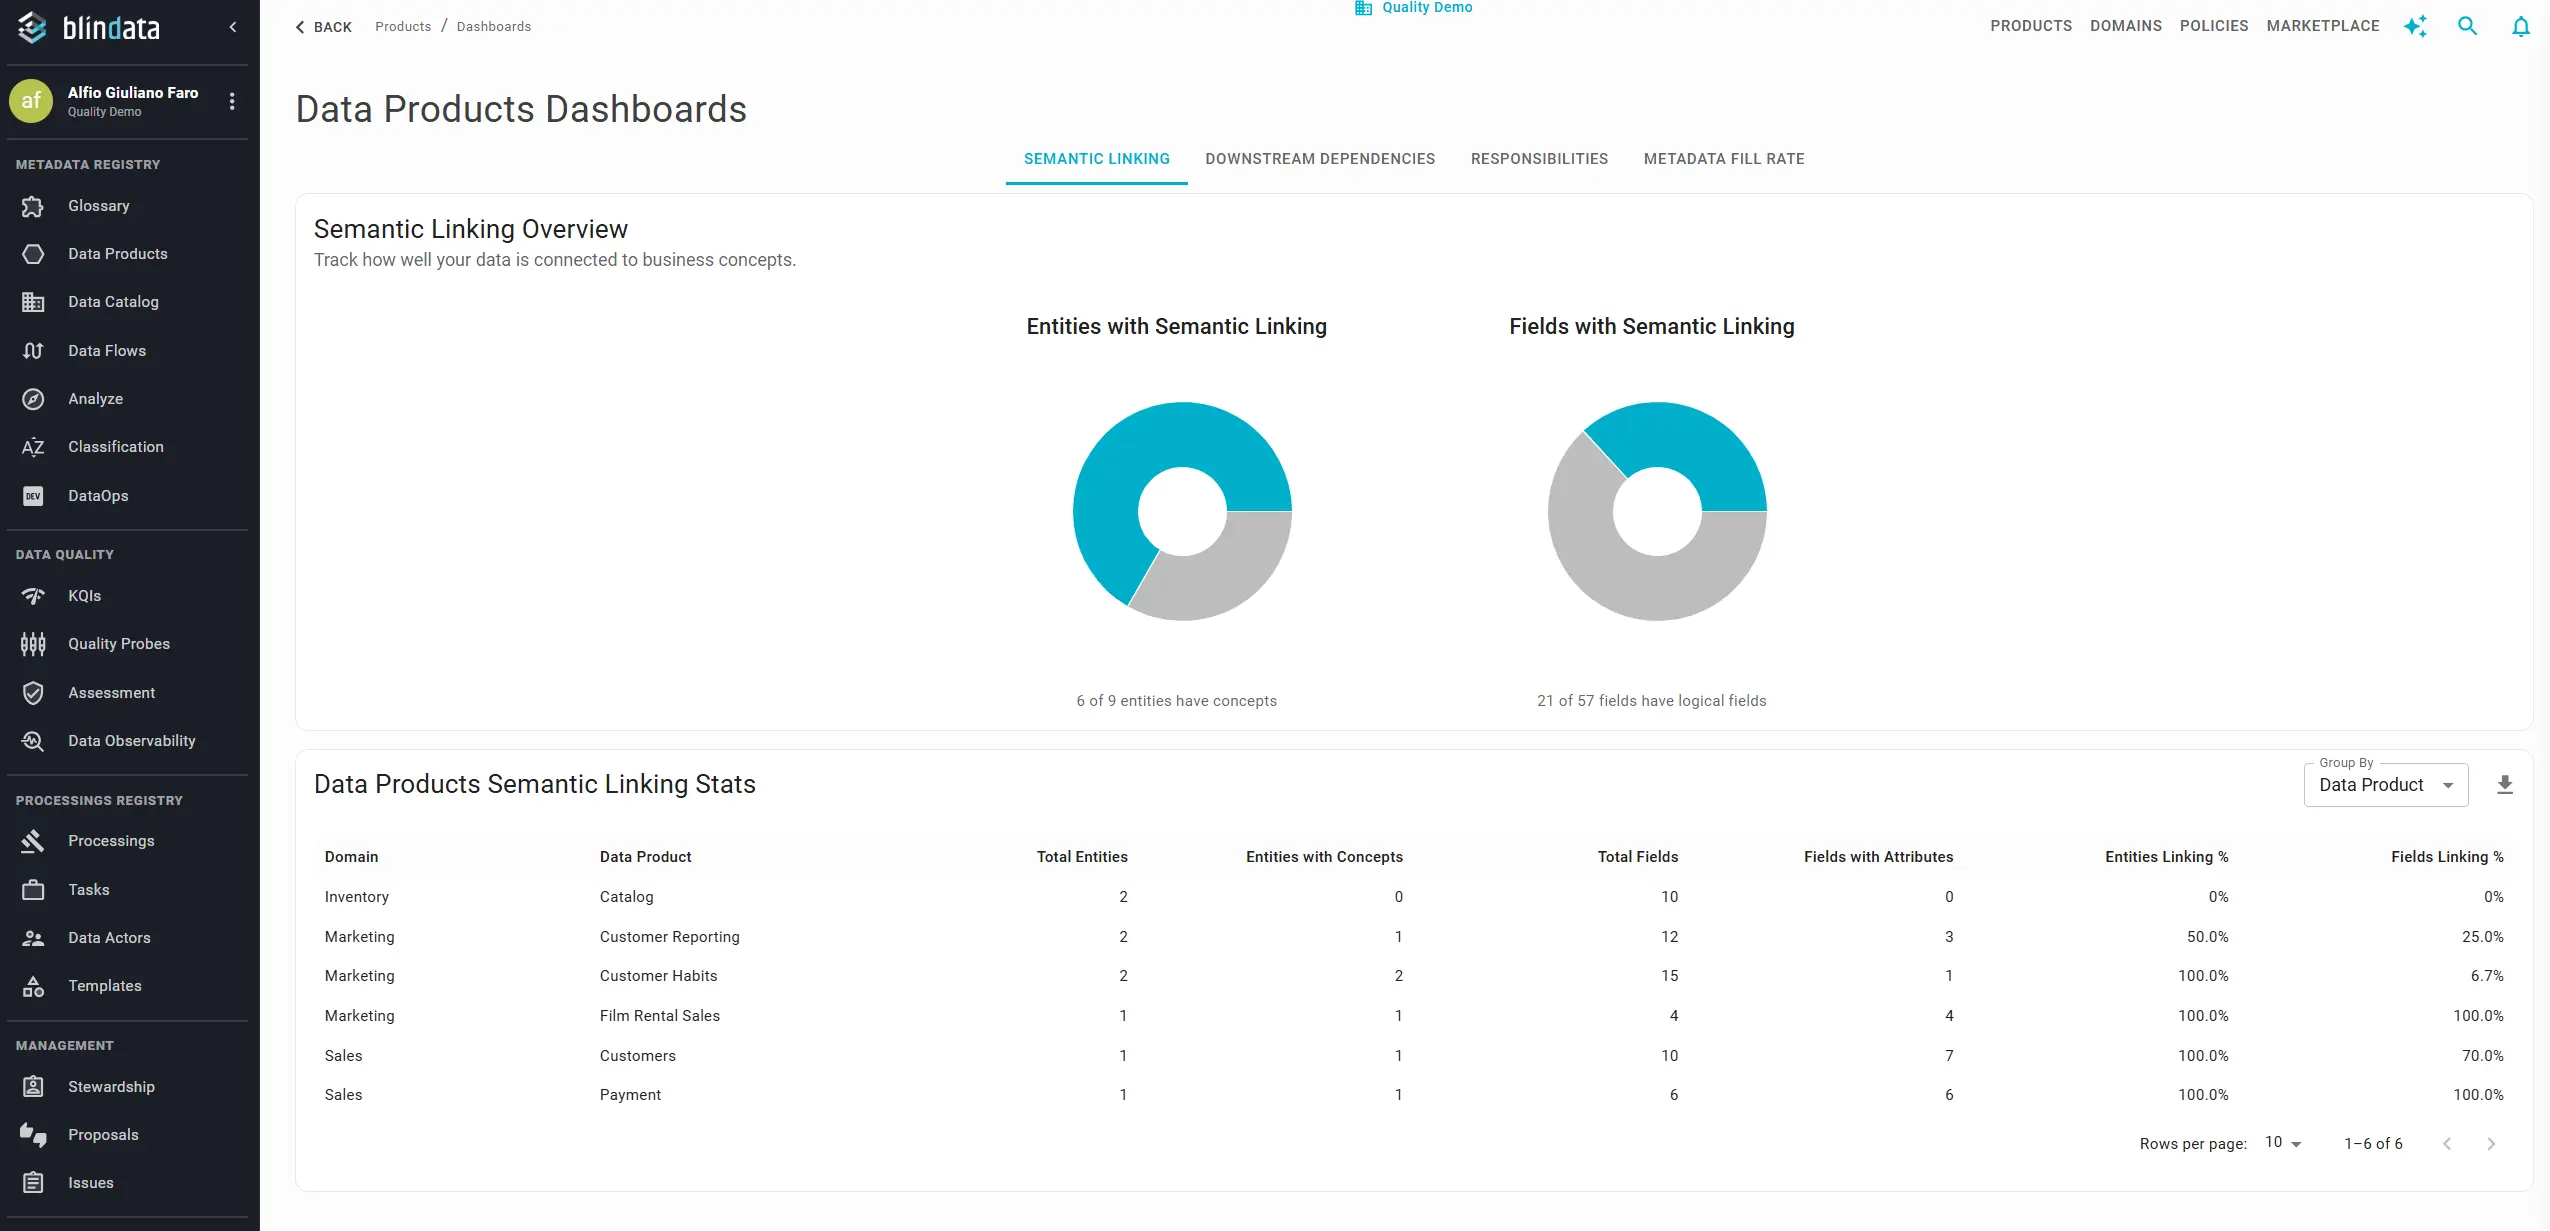
The Semantic Linking dashboard shows how closely the physical data behind your data products is connected to business concepts in the glossary.
Summary charts at the top give a portfolio-level picture:
- How many physical entities (across output ports) have at least one linked concept.
- How many physical fields have at least one linked attribute.
Detailed table: explore the numbers at the granularity you need. Use Group by to switch the level of detail:
| Group by | Use when |
|---|---|
| Domain | Comparing domains or reporting progress to domain leads |
| Data Product | Reviewing linking status product by product |
Download the table as CSV for reporting or to drive linking campaigns. Pair this view with Track Business Glossary Maturity to monitor linking from both the glossary and the product side.
Downstream Dependencies
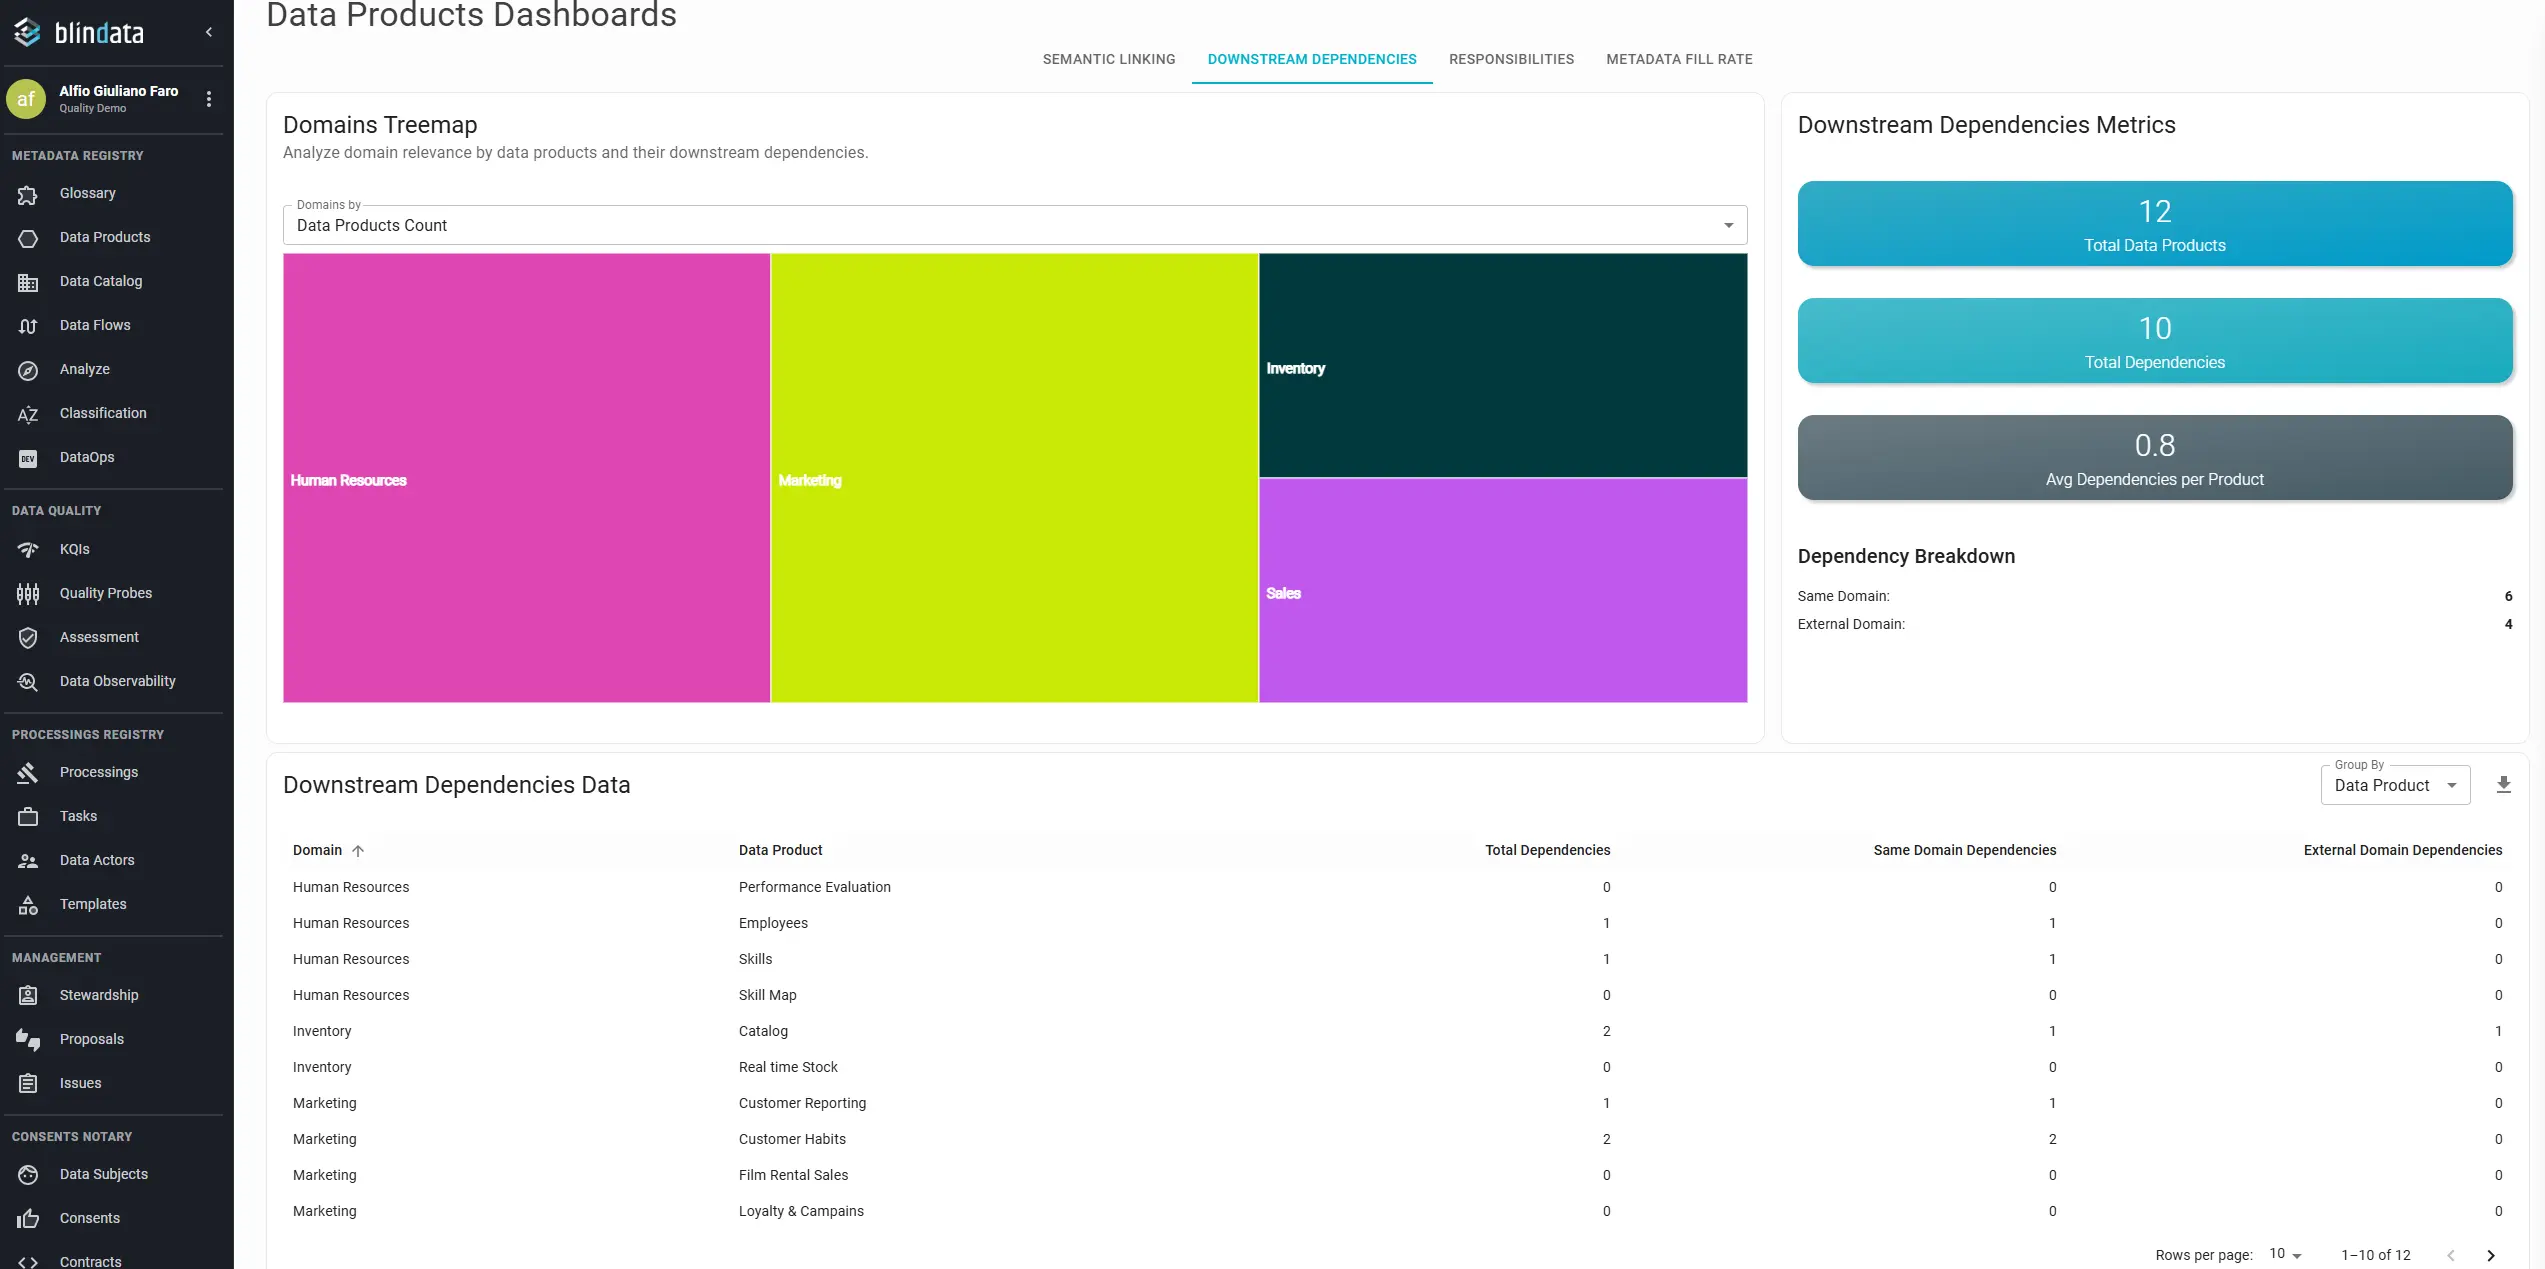
The Downstream Dependencies dashboard shows how data products relate to one another through declared port dependencies: input ports that reference another product’s output port.
Treemap at the top gives a visual overview of domains, sized by relevance (how many products they contain and how many downstream dependencies they drive). Use it to spot domains that act as large publishers or central hubs in your portfolio.
Summary figures alongside the treemap include:
- Total number of data products in scope.
- Total dependencies between products (structural links via ports).
- Average dependencies per product.
- Breakdown between dependencies within the same domain and dependencies crossing into external domains.
Detailed table: explore counts per domain or per product. Use Group by to roll up by Domain or break down by Data Product. Each row shows:
| Metric | Meaning |
|---|---|
| Dependent data products | Distinct products that declare a dependency on this product’s output port(s) |
| Same-domain dependencies | Dependents belonging to the same domain as the producer |
| External-domain dependencies | Dependents belonging to a different domain |
Export to CSV when you need to share impact analysis, plan domain boundaries, or build a reuse report for leadership.
Typical workflows:
- A domain lead groups by domain to see which areas publish the most reused products and how much consumption stays within the domain vs crosses boundaries.
- A product owner groups by data product to check downstream counts before a schema change or port deprecation.
- A platform team reviews external-domain dependencies to identify organization-wide platform products that require higher stability and SLA attention.
For actual consumption through the marketplace (access requests, granted access, consumer types), see the Marketplace Dashboard .
Responsibilities
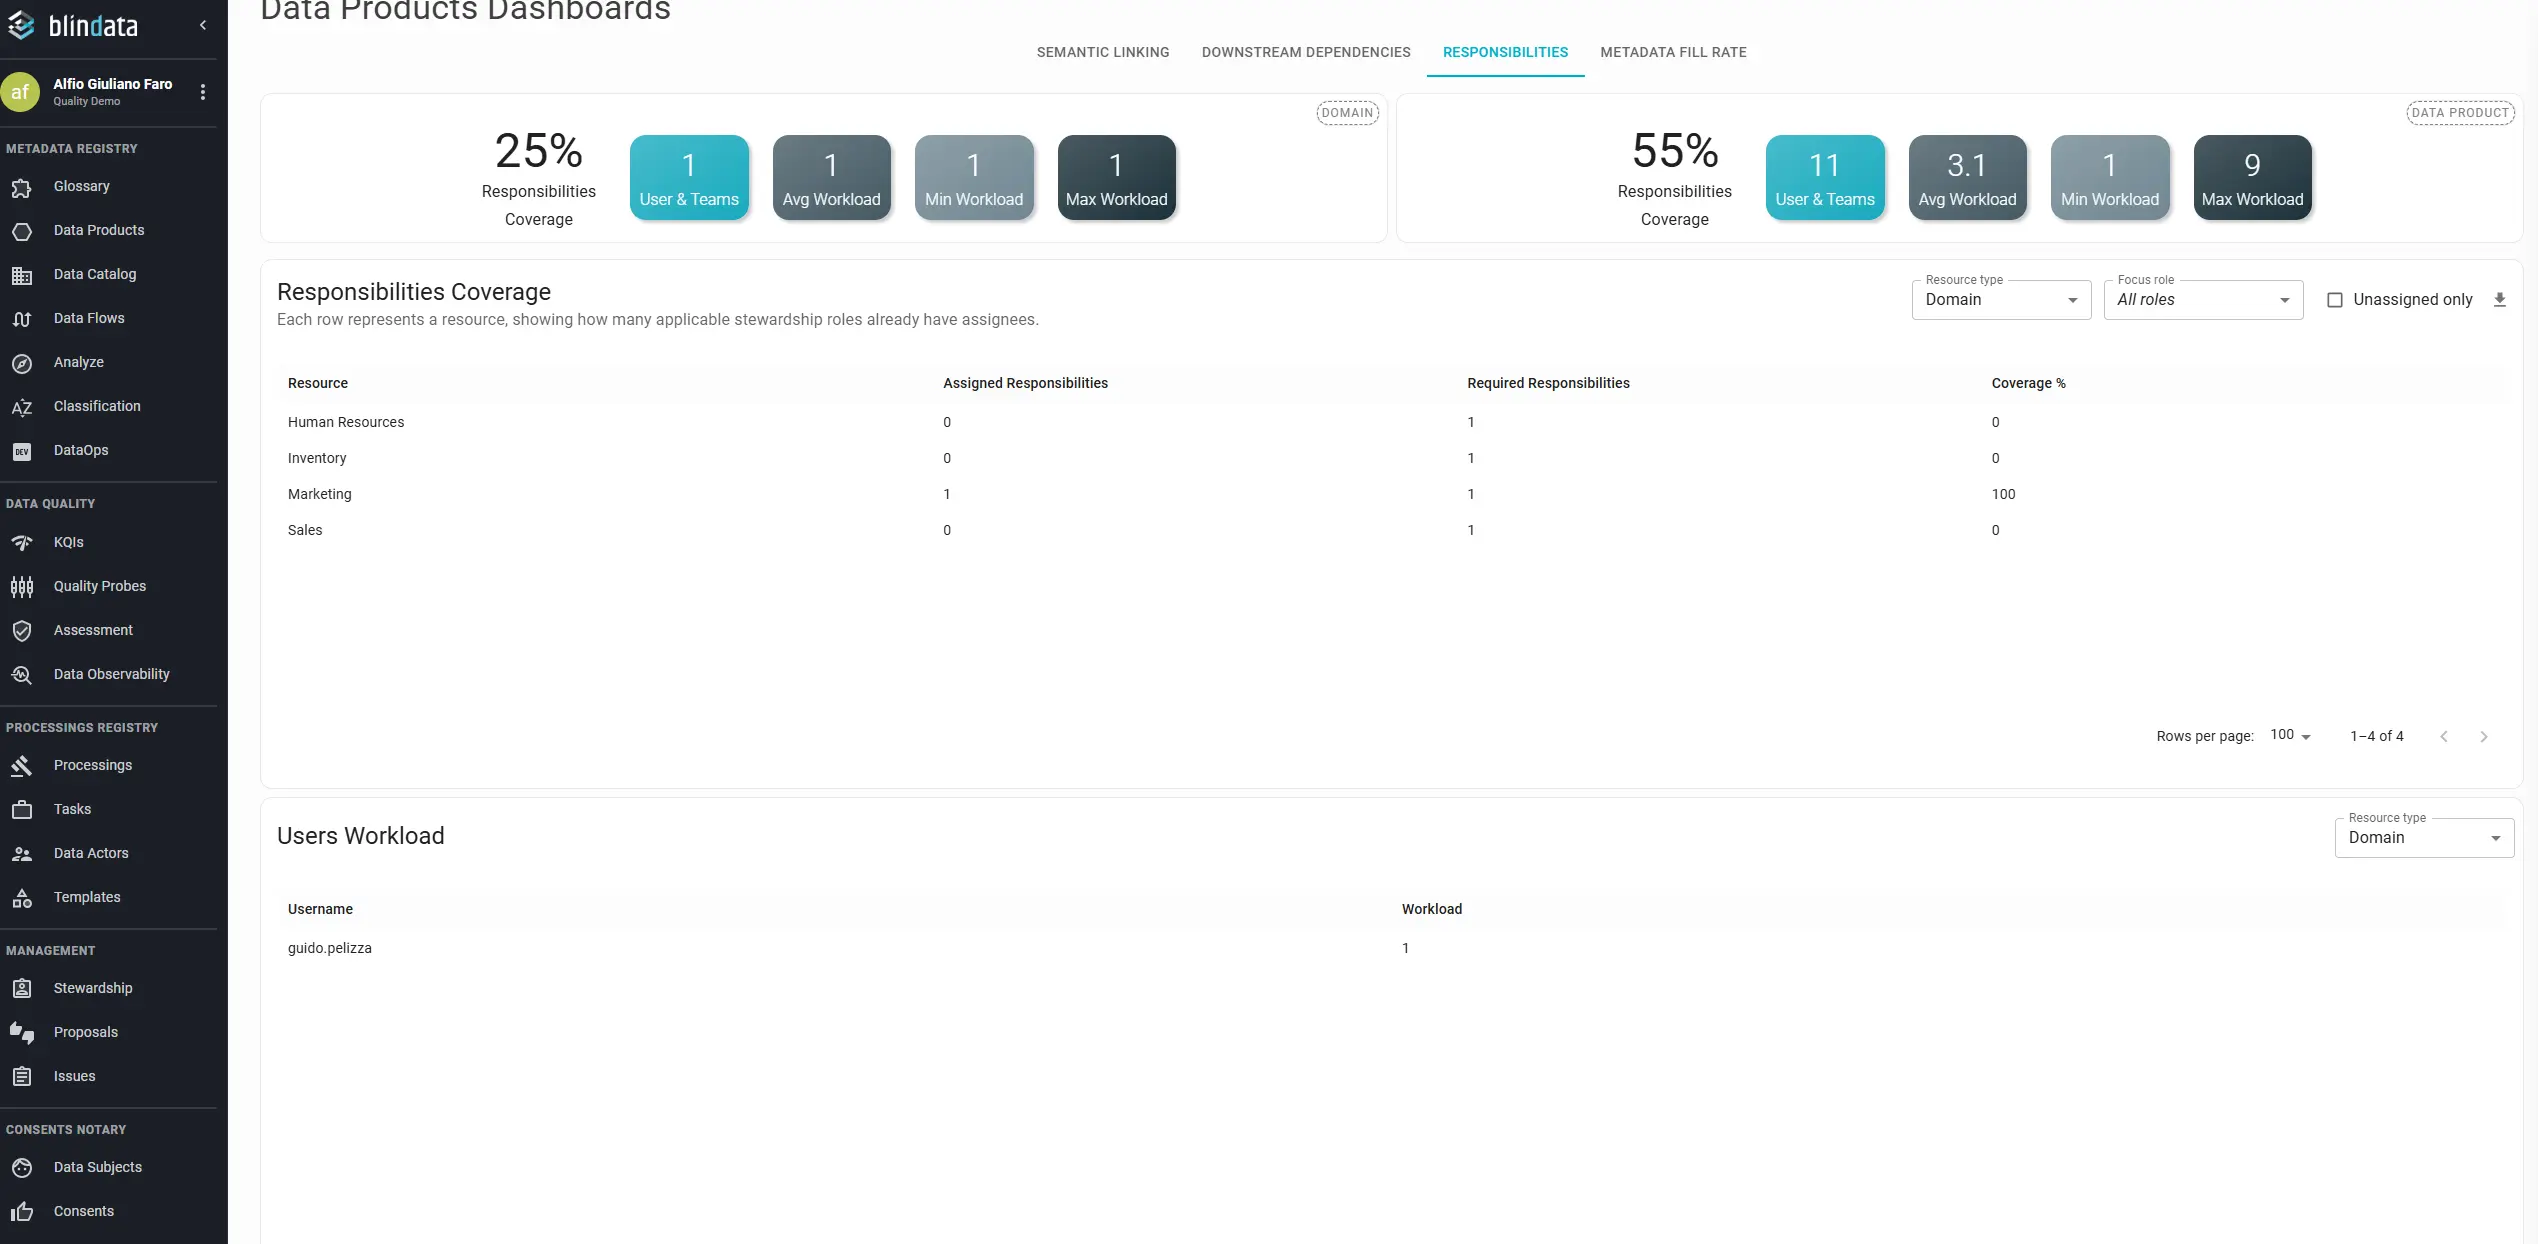
The Responsibilities dashboard shows whether data product resources have the stewardship coverage your program requires.
Summary cards report coverage for domains and data products, including:
- The share of resources with at least one assigned responsibility.
- How many users or teams are involved in product stewardship.
- How workload is distributed across owners.
Two tables go deeper:
- Resource coverage: lists each domain or data product, how many responsibilities are assigned, how many are still needed for full role coverage, and the resulting coverage percentage.
- User workload: lists each user and how many data product responsibilities they hold.
Use the filter at the top of each table to focus on domains or data products. This view is especially useful before launching a new product, reorganizing a domain team, or validating ownership after a catalog import.
For broader stewardship metrics across resource types, see also How to Monitor Stewardship Responsibilities .
Metadata Fill Rate
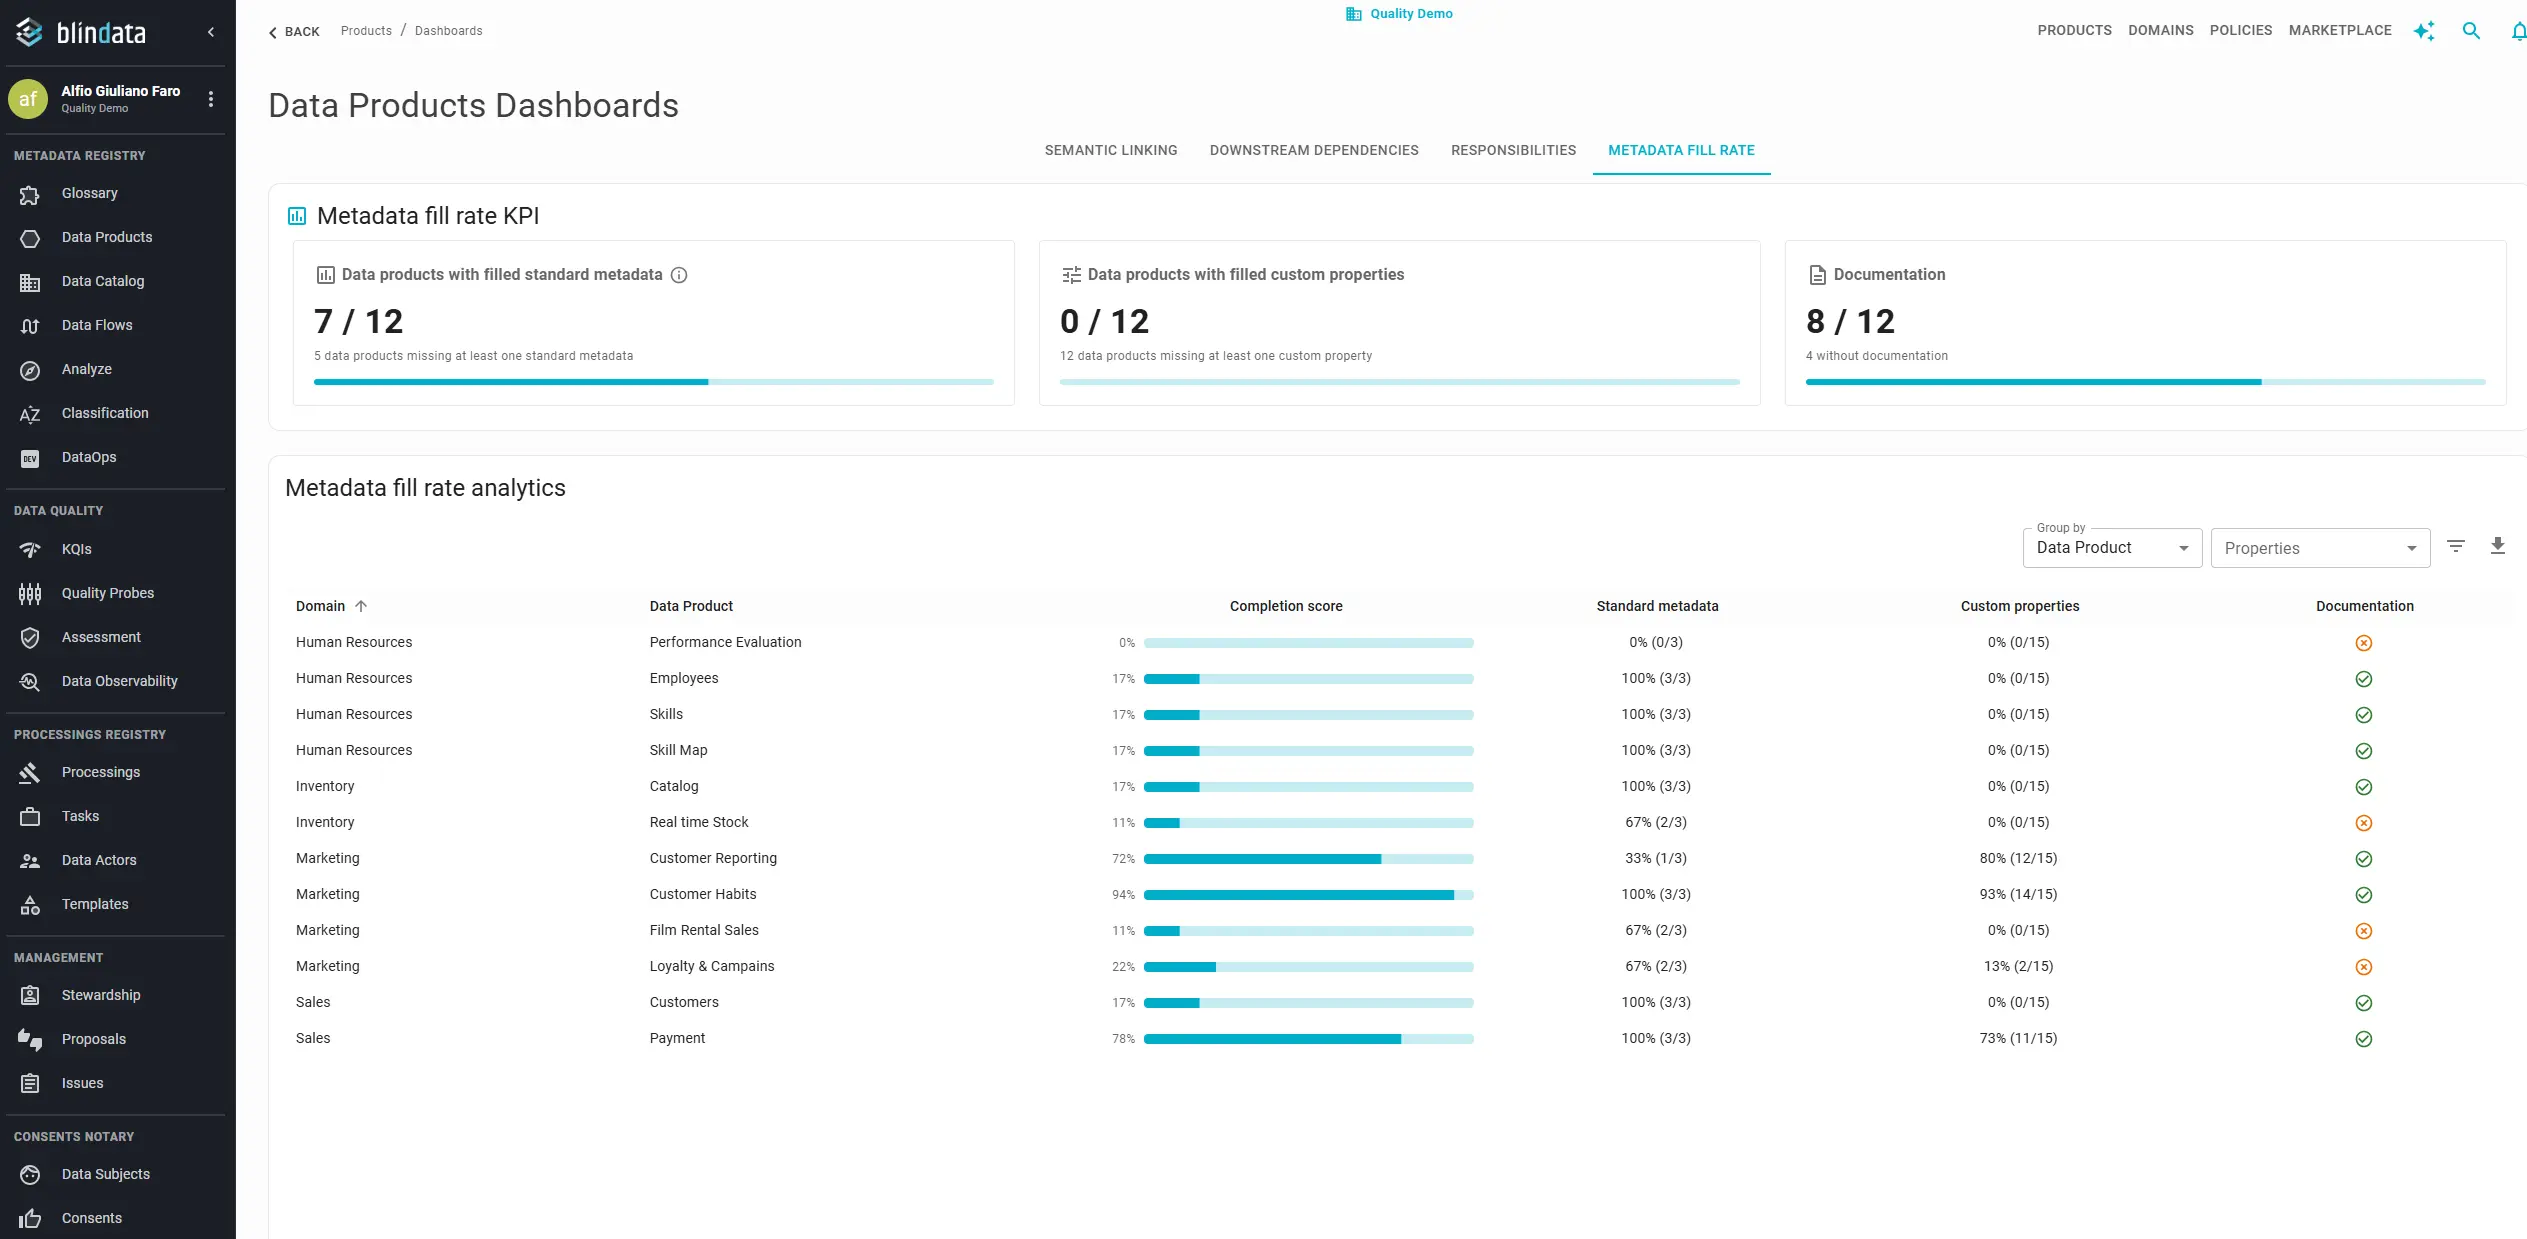
The Metadata Fill Rate dashboard answers whether the metadata defined on your data products is actually populated.
Summary indicators at the top summarize the portfolio:
- Data products with standard metadata complete.
- Data products with all custom properties filled.
- Data products that are documented.
Dynamic table: the layout adapts to toolbar choices so you stay on one screen while changing perspective. Start with Group by:
| Group by | Rows represent |
|---|---|
| Data Product | One row per product |
| Domain | Aggregated figures per domain |
The Data Product column appears only when you are viewing individual products.
By default, each row includes Domain, Data Product (when relevant), Completion score, Standard metadata, Custom properties, and Documentation. Standard metadata and Custom properties roll up several fields into a single percentage so you can scan the table quickly; use the customization options below when you need field-level detail.
Customize columns and filters
The Metadata Fill Rate table is most powerful when you shape it around the question you are trying to answer. For example, you might ask which products in the Retail domain are missing Product status, rather than only looking at aggregate percentages.
Open Properties in the toolbar. The menu is split into two groups:
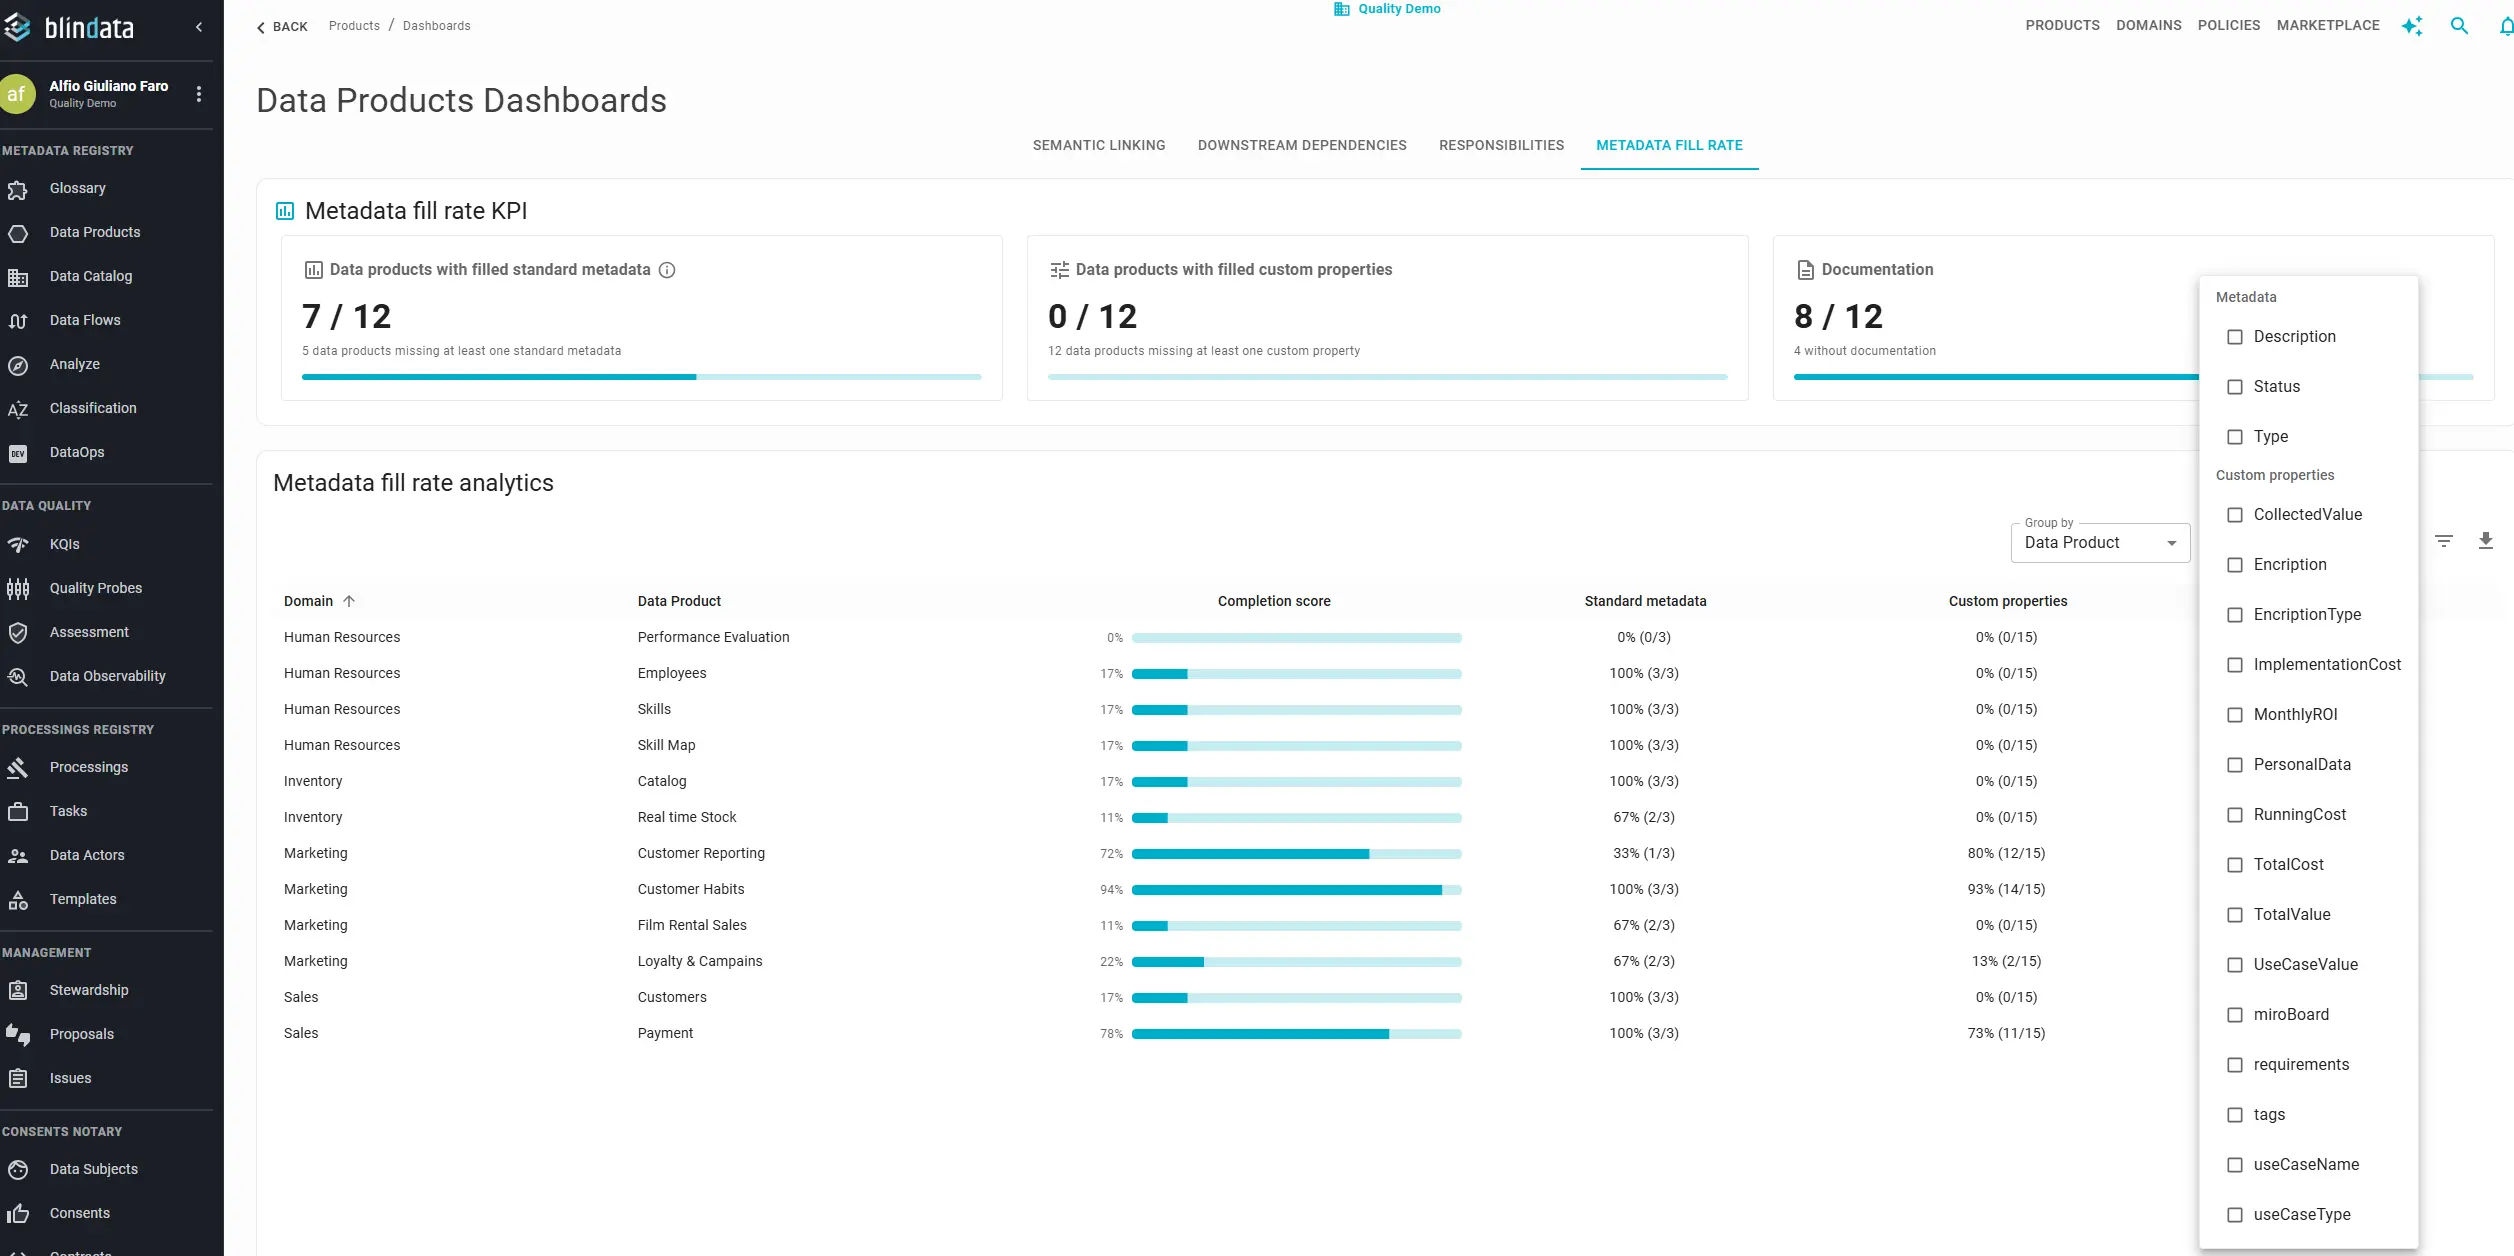
- Metadata: standard fields defined for data products: Description, Product status, and Product type.
- Custom properties: every additional property configured on data products in your tenant. Organization-specific tags, classifications, and business attributes appear here.
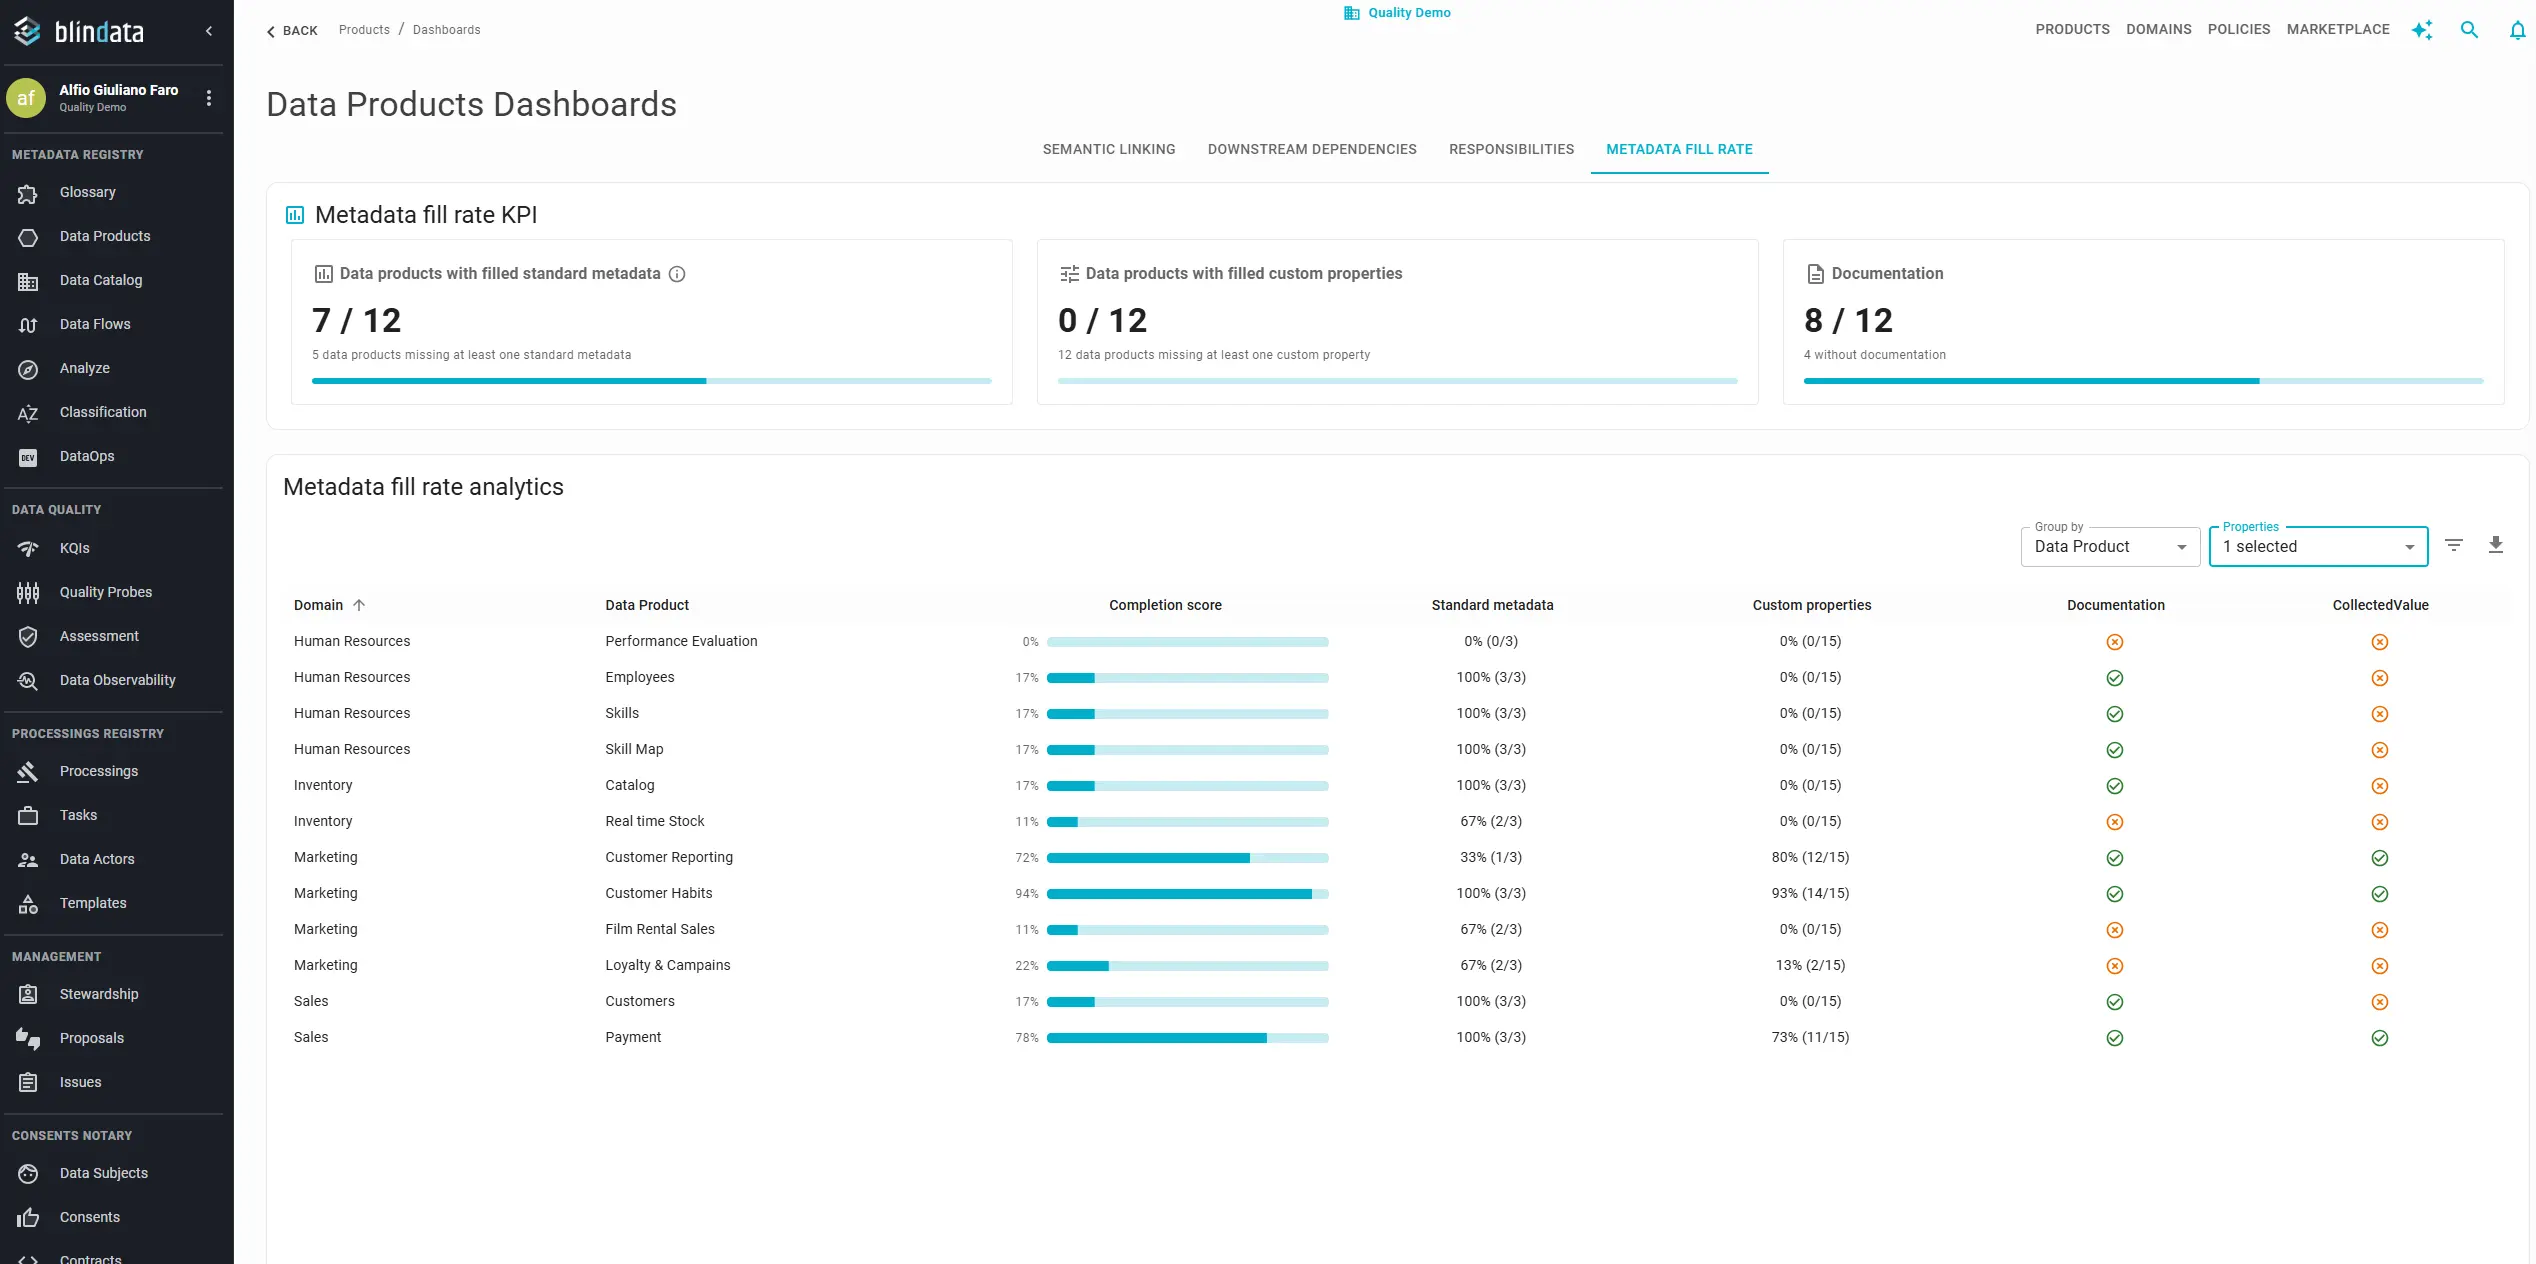
Each selected property adds a dedicated column showing, row by row, whether the value is filled or empty. Remove the selection and the column disappears. There is no limit on how many properties you can expose at once: select one field for a focused audit, or several (even all of them) to build a governance checklist view.
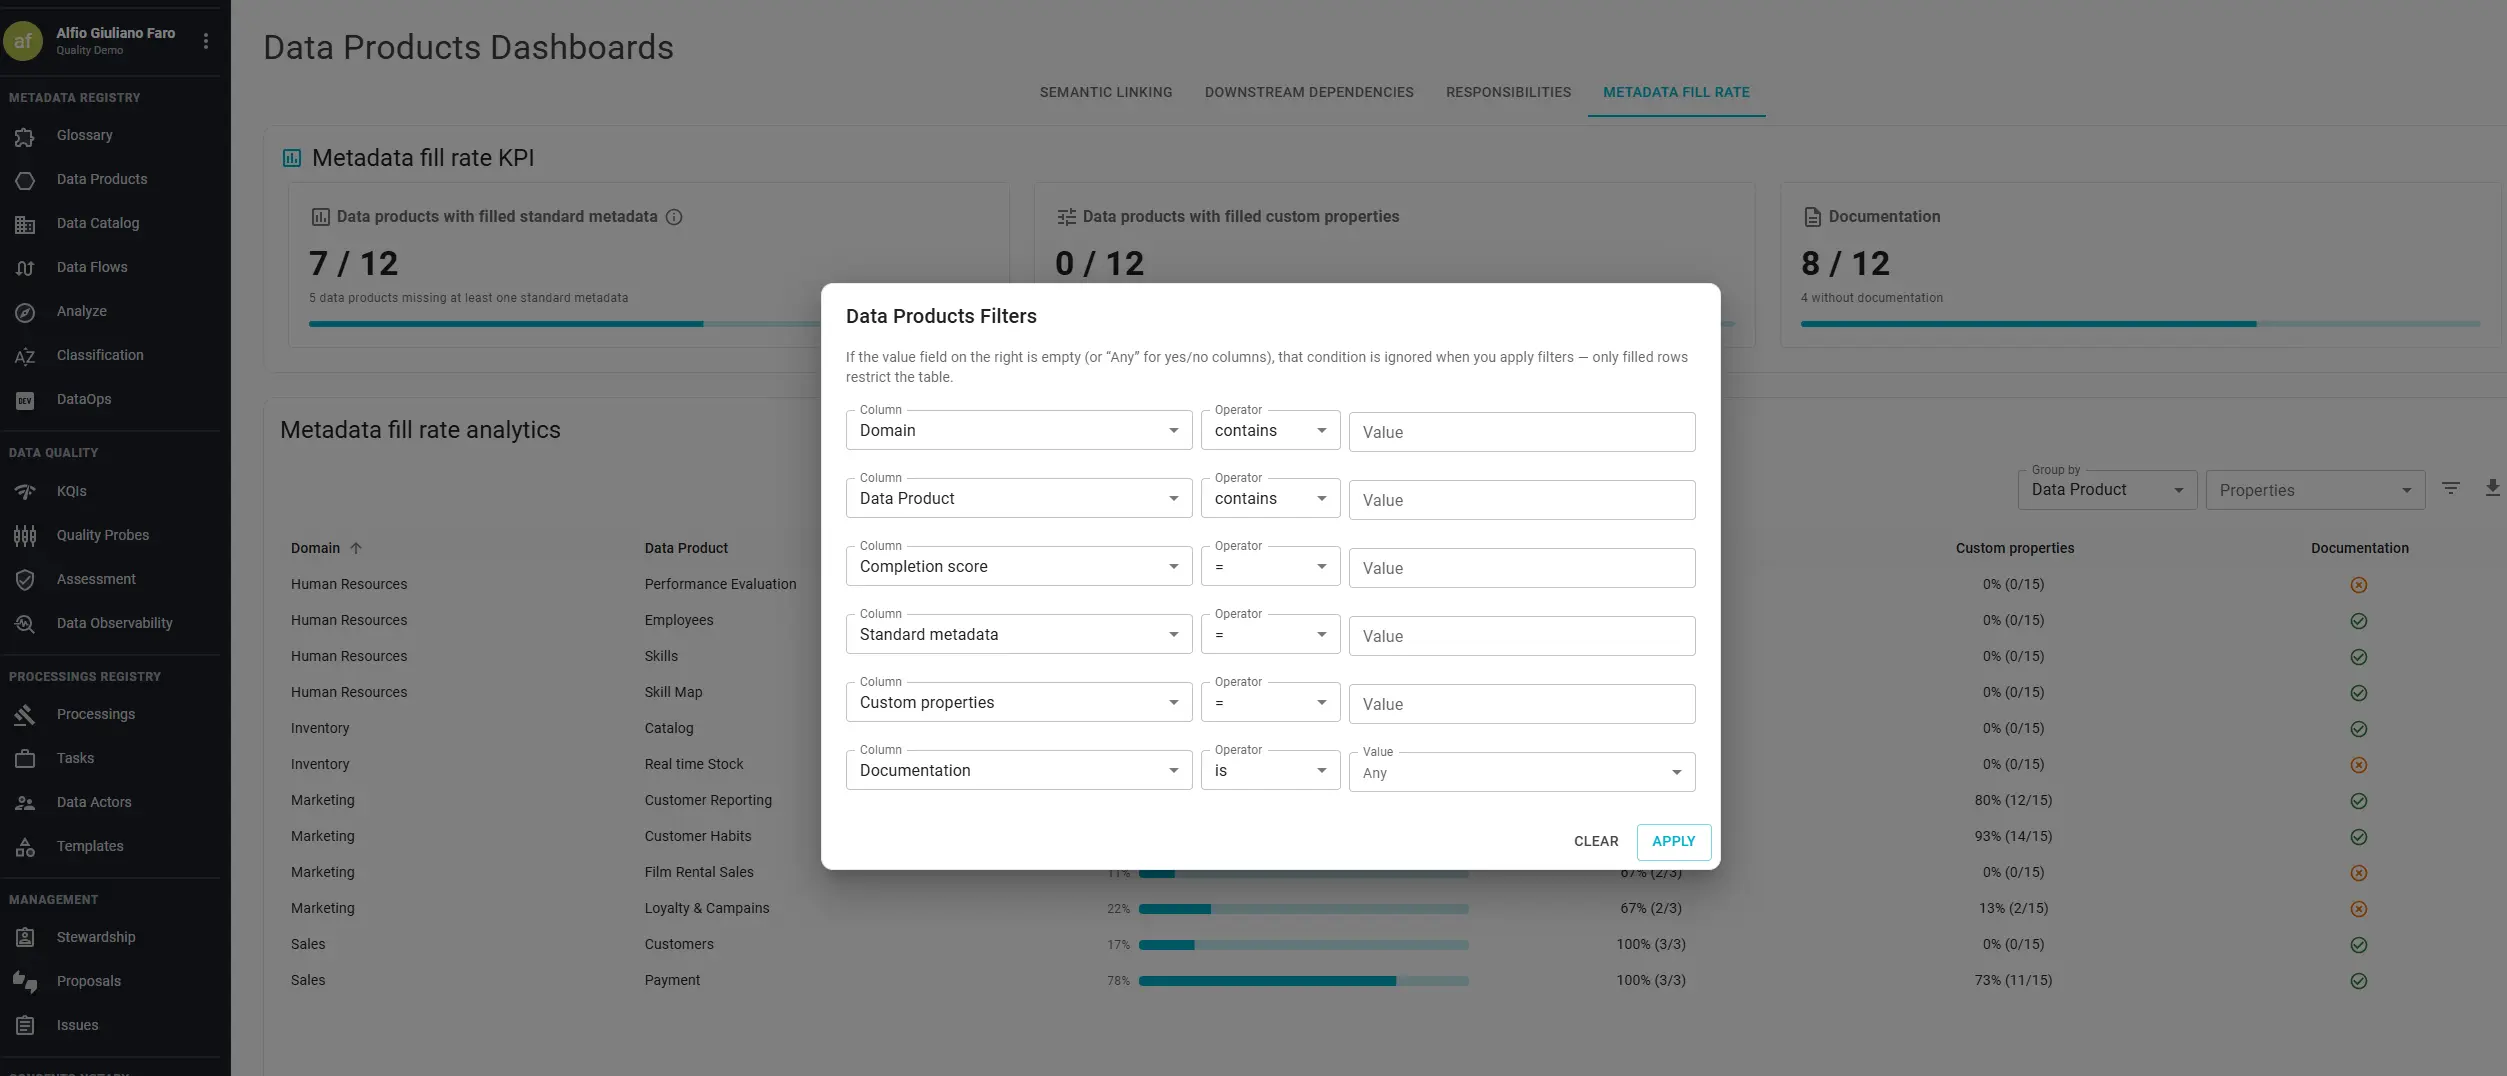
Click the Filters icon to open the filter panel. The panel lists every column currently visible, including property columns added through Properties. Pick a column, choose a condition, and apply. Only matching rows remain. Combine conditions (for example, a given domain and an empty Description and an empty custom property) to narrow down exactly the resources to fix.
Typical workflows:
- A product owner preparing a catalog cleanup adds Description, filters for empty values, and exports the list for a sprint backlog.
- A governance lead reviewing custom tagging turns on every custom property column and exports the result for a cross-domain compliance review.
- A domain lead scopes by domain in the filter panel and inspects standard metadata field by field before sign-off.
CSV export always matches what you see: same grouping, same extra columns, same filters applied.
Tips across dashboards
- On Semantic Linking and Downstream Dependencies, Group by changes how rows are grouped without leaving the dashboard. Use it to shift from executive summaries to remediation or impact lists.
- On Responsibilities, each table has its own filter for domain or data product; compare resource coverage and user workload in the same session to both fill gaps and avoid over-assigning a single owner.
- On Metadata Fill Rate, use Properties and Filters together: define the columns that matter for your success metrics first, then filter and export against those exact fields.
- Pair Downstream Dependencies with the Marketplace Dashboard when the marketplace module is enabled: structural port dependencies show design-time wiring, while marketplace metrics show who actually requested and received access.
Revisit these dashboards on a regular cadence (monthly for active programs, quarterly for stable portfolios) to turn one-off cleanups into sustained adoption tracking.